VLSI Korea
What USD 5.7 Billion in EDA and IP Revenue Is Really Saying: The Economics of the Design Boom
EDA and IP revenue hit USD 5,710.8M in Q2 2026, up 12.2%. IP took about 38.5% of the total at USD 2,199.0M, APAC grew 22.4%, and headcount fell 1.6%. What the design boom's structure says about wafer demand 12-18 months out.


30-Second Summary
- Electronic system design revenue reached USD 5,710.8M in Q2 2026, up 12.2% year over year from USD 5,089.4M. The figures were published on October 19, 2026, in the quarterly market statistics report for the electronic system design industry. The four-quarter moving average rose 11.2%. Source: Semiconductor Digest, 2026-10-19 / EconoTimes, 2026-10
- Semiconductor IP is now the largest single category: USD 2,199.0M, up 20.4%, or about 38.5% of the total. Design teams are buying reusable design assets instead of building everything in-house.
- The growth is broad but uneven. IC Physical Design and Verification rose 16.6% to USD 818.3M and Services rose 25.1% to USD 251.7M, while PCB and Multi-Chip Module revenue fell 15.4% to USD 364.2M — the only declining category.
- APAC is growing three times faster than the Americas. APAC revenue rose 22.4% to USD 2,298.7M, against 7.1% growth to USD 2,443.5M in the Americas. Design activity is shifting geographically.
- Revenue rose 12.2% while industry headcount fell 1.6%, from 72,529 to 71,396. That combination is the clearest statistical trace yet of AI-assisted design automation and of pricing power in design tools and IP.
Background
The industry nobody sees, measured every quarter
Every chip begins as a design. Before a wafer is fabricated, before a package is assembled, engineering teams spend months or years working in electronic design automation (EDA) software, licensing semiconductor intellectual property (IP) — ready-made processor cores, interface blocks, memory controllers and verification components — and running the physical design and verification steps that turn an idea into a manufacturable layout.
The electronic system design (ESD) industry is the supply chain behind that work. Its quarterly revenue statistics are one of the few regularly published, category-by-category measurements of how much the world is spending to design chips. The Q2 2026 report, released on October 19, 2026, put the total at USD 5,710.8M, up 12.2% from USD 5,089.4M in Q2 2025. The immediately preceding quarter, Q1 2026, was slightly larger at USD 5,747.8M, up 12.7% year over year — so the Q2 figure represents a second consecutive quarter of double-digit growth at a run rate above USD 5.7 billion, not a one-quarter spike.
Why this number matters more than most
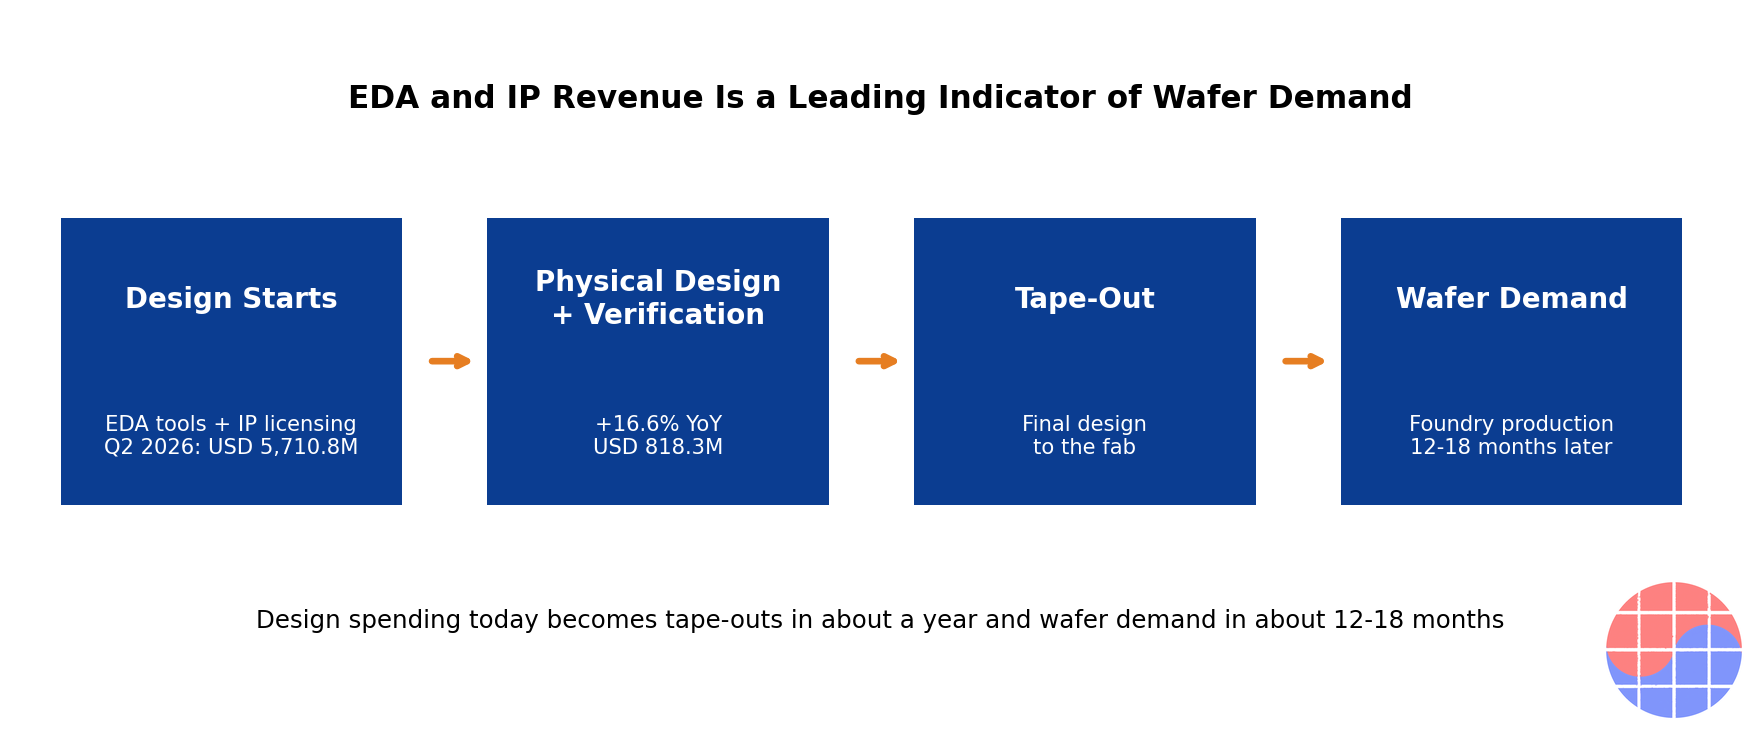
Design spending sits at the very front of the semiconductor value chain. A design started today becomes a tape-out in roughly a year, and wafer demand roughly 12 to 18 months later. Equipment orders, foundry utilization and memory demand are all, in effect, downstream echoes of decisions that show up first in EDA and IP revenue. That makes this quarterly series a leading indicator: it does not describe the chip cycle that is happening now, it describes the chip cycle that has already been decided and will arrive next.
The Q2 2026 data carry three structural messages underneath the headline growth rate. First, the mix is shifting toward IP — toward buying design rather than making it. Second, the geography is shifting toward APAC. Third, the industry is producing more revenue with fewer people, which says something important about where value and pricing power now sit in the design stack.
Business Deep Dive
The category breakdown: IP takes the crown
| Category | Q2 2026 revenue (USD M) | YoY change | Share of total |
|---|---|---|---|
| Semiconductor IP | 2,199.0 | +20.4% | About 38.5% |
| CAE | 2,077.6 | +7.7% | About 36.4% |
| IC Physical Design and Verification | 818.3 | +16.6% | About 14.3% |
| PCB and Multi-Chip Module | 364.2 | -15.4% | About 6.4% |
| Services | 251.7 | +25.1% | About 4.4% |
| Total | 5,710.8 | +12.2% | 100% |
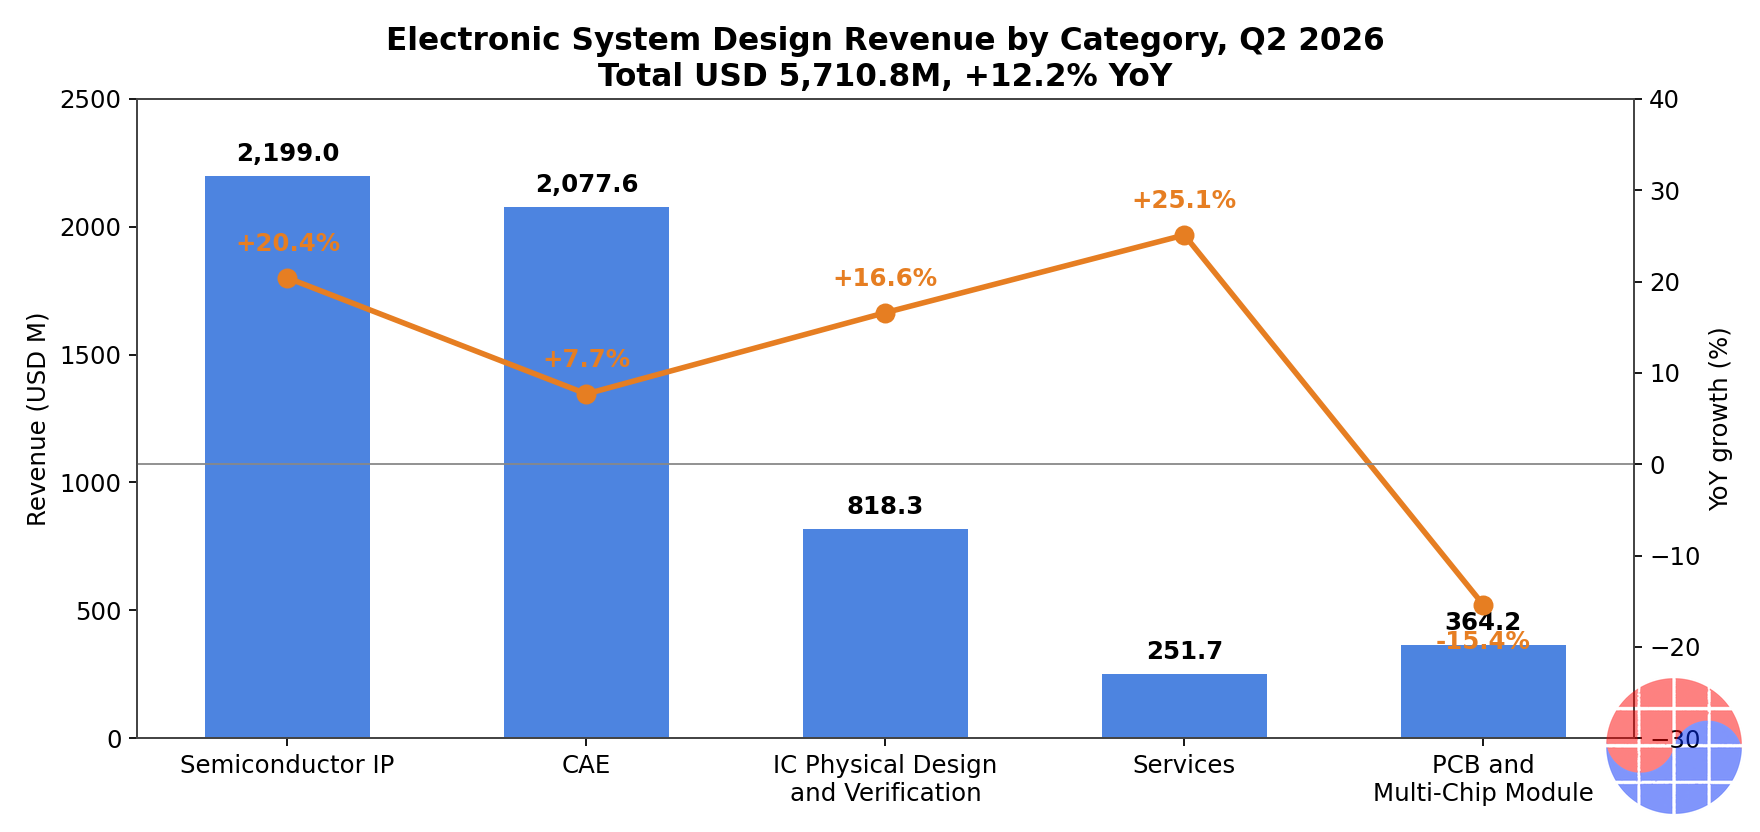
Electronic system design industry revenue by category, Q2 2026. Source: Semiconductor Digest, 2026-10-19
Semiconductor IP at USD 2,199.0M and +20.4% is the story of the quarter. IP is no longer a supporting category; at about 38.5% of all design-industry revenue, it is the largest single pool of money in chip design. CAE — computer-aided engineering, the core simulation and design tool category — remains the second pillar at USD 2,077.6M, growing a steadier 7.7%.
Two smaller categories carry outsized information. IC Physical Design and Verification grew 16.6% to USD 818.3M. Physical design and verification spending happens late in a design project, when a chip moves from architecture on paper toward implementation and sign-off. Growth there means designs are not just being started — they are being pushed through to completion. Services grew fastest of all, up 25.1% to USD 251.7M, which suggests customers are buying expertise and capacity alongside tools: when internal teams are saturated, they rent capability.
The one decline is equally informative. PCB and Multi-Chip Module revenue fell 15.4% to USD 364.2M. Complexity in modern systems is concentrating inside the silicon — in chiplets, advanced packaging and larger SoCs — rather than on the board. The board-level design business is where that migration shows up as a loss.
The regional breakdown: design work moves east
| Region | Q2 2026 revenue (USD M) | YoY change |
|---|---|---|
| Americas | 2,443.5 | +7.1% |
| APAC | 2,298.7 | +22.4% |
| EMEA | 665.6 | +2.3% |
| Japan | 303.1 | +9.3% |
| Total | 5,710.8 | +12.2% |
Electronic system design industry revenue by region, Q2 2026. Source: Semiconductor Digest, 2026-10-19
The Americas remain the largest design market at USD 2,443.5M, but APAC, at USD 2,298.7M and growing 22.4%, is closing the gap at speed. The difference between the two regions is now only about USD 145M per quarter. If the current growth differential persisted, APAC would pass the Americas as the largest design-spending region within a few quarters. EMEA grew just 2.3% to USD 665.6M, and Japan grew 9.3% to USD 303.1M — respectable, but not where the momentum is.
Read strategically, this is the geography of custom silicon. APAC is home to the foundry ecosystem, to a fast-growing fabless sector, and to large electronics manufacturers increasingly designing their own chips. Design spending follows design teams, and design teams are being hired — and design centers opened — disproportionately in APAC.
The economics of IP at 38.5%
Why does IP keep outgrowing the tools used to design with it? Because the economics of chip design have inverted. At advanced nodes, designing every block from scratch is slow and expensive, and the scarcest resource is not software seats but experienced engineering time. Buying a proven IP block converts a fixed internal cost — a team, a schedule, a verification burden — into a license fee plus, in many models, a royalty per chip shipped.
That produces two very different business models inside the same category. The license model is paid up front and behaves like software revenue: high gross margin, recognized early, tied to design starts. The royalty model is paid per unit over the life of a product: smaller at first, but it compounds with volume and ties the IP supplier's revenue to the customer's commercial success. A category growing at 20.4% with a rising share of total design spending means both engines are firing — more designs are starting, and more of each design's content is being bought rather than built.
This is the financial signature of the custom silicon era. Hyperscalers designing their own AI accelerators, automotive companies designing their own controllers, and consumer electronics firms designing their own SoCs all face the same arithmetic: own the architecture and the differentiating blocks, license everything else. Every new entrant to chip design is, almost by definition, a heavy IP customer, because no new entrant has thirty years of accumulated internal design assets.
The leading-indicator chain
The practical value of this dataset is timing. The chain runs in a predictable sequence: design starts drive EDA tool and IP license revenue first; physical design and verification spending peaks as projects approach tape-out; tape-outs convert into wafer starts at foundries; wafer starts become packaged chips, equipment utilization and, eventually, end-product supply.
| Stage | What happens | Typical lag to wafer demand |
|---|---|---|
| Design start | Architecture, IP licensing, tool seats | About 12-18 months |
| Physical design and verification | Implementation, sign-off preparation | About 6-12 months |
| Tape-out | Final design handed to the fab | About 3-6 months |
| Wafer production | Foundry manufacturing and packaging | 0 |
On that clock, a Q2 2026 design-spending surge — with the late-stage physical design category up 16.6% — points to tape-out activity through late 2026 and wafer demand through 2027 and into 2028. It does not guarantee that every design succeeds commercially. It does mean the industry's customers have already committed the money that precedes production, which is why this series deserves attention from anyone tracking foundry utilization, equipment orders or memory demand two to four quarters out.
Revenue up, headcount down
The most quietly remarkable line in the report is employment. Companies tracked in the statistics employed 71,396 people in Q2 2026, down 1.6% from 72,529 a year earlier — a decline of more than 1,100 positions in an industry whose revenue grew 12.2% in the same period.
Two forces explain the combination. The first is automation: AI-assisted design tools genuinely raise the output of each engineer, and vendors have spent several years embedding machine learning into placement, verification and debugging flows. The second is pricing power. An industry that can raise revenue per employee at this pace is an industry whose products are becoming more valuable per seat — larger designs, more verification, more sign-off corners, more IP content per chip — and whose customers have few alternatives. Design tools and proven IP are among the least substitutable purchases in the entire semiconductor chain: switching costs are measured in re-trained teams and re-verified designs, not in license fees.
The caution is that headcount is a lagging and company-reported measure, and a single year of decline does not prove a permanent productivity regime. But the direction is consistent with everything else in the report: more design output, bought more than built, produced by slightly fewer people.
Chase's Take
The headline number — USD 5,710.8M, up 12.2% — is the least interesting part of this report. Headline growth in a boom year is expected. The structure underneath it is what deserves attention.
Start with the mix. When IP becomes the largest category in design spending at about 38.5% of the total and grows at 20.4%, the industry is telling you how chips get designed now: assembled from bought components around a core of owned differentiation. That is a permanent-looking change in the division of labor, not a cyclical blip. The winners in that structure are whoever owns reusable, verifiable, hard-to-replicate design assets — and the strategic question for every design team is no longer "can we build this block?" but "is this block where our differentiation lives?" If the answer is no, the market now prices building it yourself as an indulgence.
Second, watch the physical design number. Design starts are cheap talk; companies start designs they later cancel. Physical design and verification spending at +16.6% is money spent near the end of projects, by teams that intend to tape out. Combined with Services at +25.1% — customers paying for outside capacity to finish — the picture is of a pipeline that is not just wide but moving. That is what makes the leading-indicator reading credible this quarter rather than merely plausible.
Third, the regional story is a strategy story. APAC growing at 22.4% while the Americas grow at 7.1% is not primarily about cost. It is about where the custom-silicon customers, the foundry-adjacent design ecosystem and the new design centers are. Design capacity built in APAC today becomes design influence — over architectures, standards and supplier choices — for a decade. Companies that treat design geography as a procurement detail will misread where the industry's center of gravity is moving.
Finally, the headcount line. Revenue +12.2% with headcount -1.6% is the design industry's version of a question now running through the whole AI economy: how much of this growth is demand, and how much is leverage? Here, the answer looks like both — genuinely more design work, done with genuinely more automation, sold by vendors with genuine pricing power. The risk to underwrite is not that the number reverses next quarter. It is that an industry producing more with fewer people becomes dependent on a small number of tool and IP chokepoints — and chokepoints, in semiconductors, eventually attract both premium pricing and political attention.
Implications
- Foundries and equipment suppliers: treat Q2 2026 design spending as booked future demand. The late-stage categories (physical design and verification +16.6%) support tape-out momentum into 2027, with wafer demand following the usual 12-18 month design-to-production lag.
- Fabless and custom-silicon teams: the IP market's 20.4% growth is your build-versus-buy benchmark. If your internal block is not a differentiator, the market is telling you its price — and your competitors are already paying it and shipping sooner.
- IP vendors: at about 38.5% of total design spending, IP is the industry's center of gravity. Royalty-linked models gain most when design starts convert to volume; the APAC growth rate of 22.4% says where the next licensing negotiations will happen.
- Investors: the signal hierarchy is mix first, headline second. IP share, APAC growth and the revenue-versus-headcount gap (revenue +12.2%, headcount -1.6%) describe the structure; the total describes the weather. Watch whether PCB and Multi-Chip Module (-15.4%) stabilizes or confirms a lasting shift of complexity into the package.
- Policymakers: design is the least capital-intensive and most strategically leveraged layer of the chip stack. A region growing design spending at 22.4% is building influence that fabs alone do not confer.
FAQ
How large was the electronic system design industry in Q2 2026?
Revenue totaled USD 5,710.8M in Q2 2026, up 12.2% from USD 5,089.4M in Q2 2025, according to the quarterly market statistics published on October 19, 2026. Q1 2026 was USD 5,747.8M, up 12.7% year over year, so growth has held in double digits for two consecutive quarters.
Why is semiconductor IP the largest and fastest-growing major category?
IP revenue reached USD 2,199.0M, up 20.4%, about 38.5% of the industry total. Custom silicon economics drive it: designing every block in-house at advanced nodes is slow and consumes scarce engineering time, so teams license proven blocks and keep internal effort for differentiating architecture. License fees monetize design starts; royalties monetize shipping volume.
What does EDA and IP revenue predict about future chip demand?
Design spending leads production. Designs licensed and started today typically reach tape-out within about a year and wafer demand within roughly 12 to 18 months. Growth in late-stage categories — IC Physical Design and Verification rose 16.6% — indicates projects are advancing toward tape-out, which supports foundry wafer demand through 2027.
Why did revenue rise 12.2% while headcount fell 1.6%?
Tracked companies employed 71,396 people, down from 72,529 a year earlier. The combination reflects AI-assisted design automation raising output per engineer, plus pricing power: larger, more complex designs require more tool and IP content per seat, and switching tools or proven IP mid-project is costly, so vendors can sustain price increases.
Sources: Semiconductor Digest, 2026-10-19; EconoTimes, 2026-10. All revenue figures are from the electronic system design industry's quarterly market statistics report for Q2 2026, published October 19, 2026. This article is analysis, not investment advice.
📩 Subscribe to VLSI Korea
Get our daily semiconductor deep-dives delivered to your inbox first. Free to subscribe.