VLSI Korea
ERCOT Batch Zero: Why a 474 GW Queue Is Not Yet AI Chip Demand
ERCOT's 474 GW queue is not yet chip demand. Batch Zero separates request, study, energization, and system acceptance.


The answer first: ERCOT's 474 GW large-load request queue should not be translated directly into AI accelerators, HBM, foundry wafers, or server revenue. The 474 GW figure is requested electrical load. ERCOT's August 20, 2026 public presentation says it reviewed 290 dynamic models and found about 18% acceptable on the first review. It also states that inclusion in a Quarterly Stability Assessment does not itself authorize energization. Between queue megawatts and chip demand sit separate denominators for eligibility, grid study, financing, construction, energization, and rack acceptance.
This article serves two reader jobs. Semiconductor strategy and supply owners can convert headline megawatts into probability-weighted evidence before changing capacity decisions for HBM, logic, packaging, substrates, and power components. Data-center, server, EDA, and power engineers can map ownership from the grid-side dynamic model through rack power, cooling, SI/PI, firmware, and final acceptance. It improves two decisions: when to promote requested megawatts into qualified semiconductor demand, and which official documents and field metrics should support or break that thesis over the next six to twelve months.
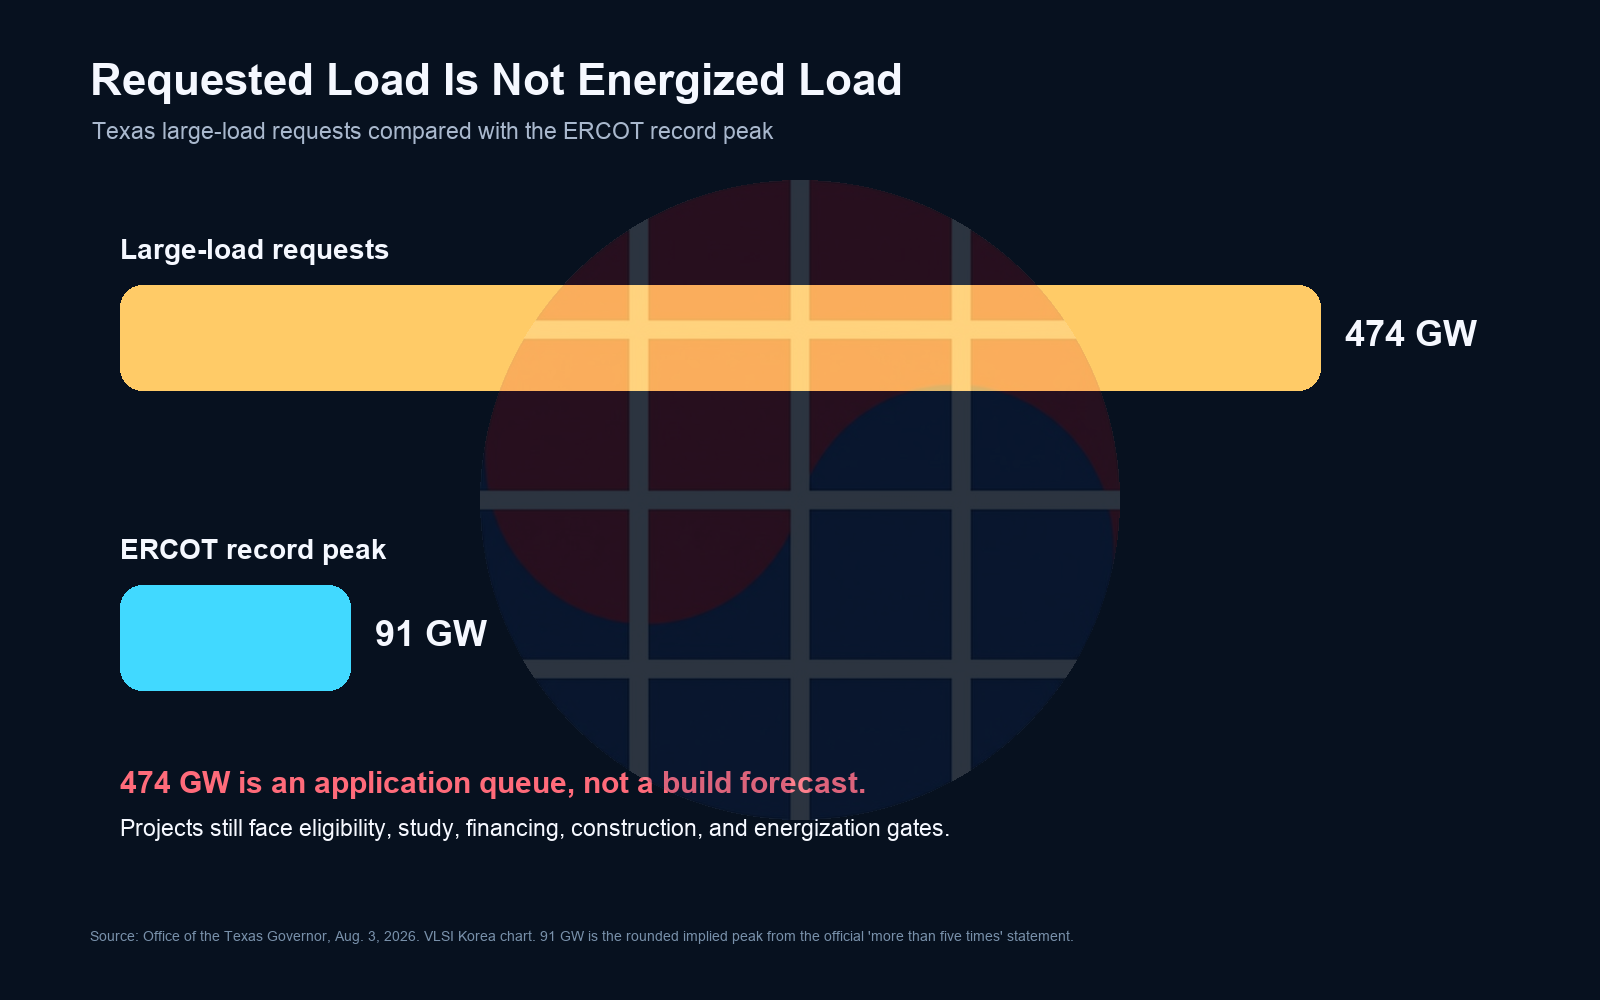
VLSI Korea view: A megawatt queue is an inventory for starting verification, not evidence of completed demand. Semiconductor demand requires dated proof that the same project has crossed grid, capital, construction, and compute-acceptance gates.
1. The 474 GW headline is a denominator problem
The Texas Governor's August 3 directive says ERCOT was considering approximately 474 GW of connection requests, more than five times the Texas record peak. The directive asked the PUCT and ERCOT to conduct a comprehensive verification and audit of data-center projects advancing through the interconnection process. Projects that fail the requirements can be denied connection to the Texas grid.
Less than two months earlier, ERCOT's June 18 release said it was tracking more than 438,000 MW of large-load requests and that nearly 89% came from data centers. The arithmetic increase of roughly 36 GW does not mean 36 GW of sites were built. Duplicate intent, optionality across service territories, early land positions, and unequal maturity in power and customer contracts make queue growth and energized growth different time series.
Batch Zero is a one-time transitional study designed in part to reduce this denominator risk. The ERCOT Large Load Integration page directs facilities of 75 MW or more to the eligibility paths in PGRR145 and requires load information, dynamic models, attestations, and provider confirmation. The 75 MW line defines a process boundary for large loads. It is not a threshold for a semiconductor order.
The consensus is that AI infrastructure has become a major variable in Texas power planning. The precise disagreement comes next. An optimistic interpretation treats 474 GW as a leading indicator of the future compute footprint. VLSI Korea treats it as an upper-bound discovery inventory whose denominator must be renamed at each evidence gate. This matters now because the August verification process has started to expose public evidence requirements and failure points between application intent and energization.
2. The five evidence gates inside Batch Zero
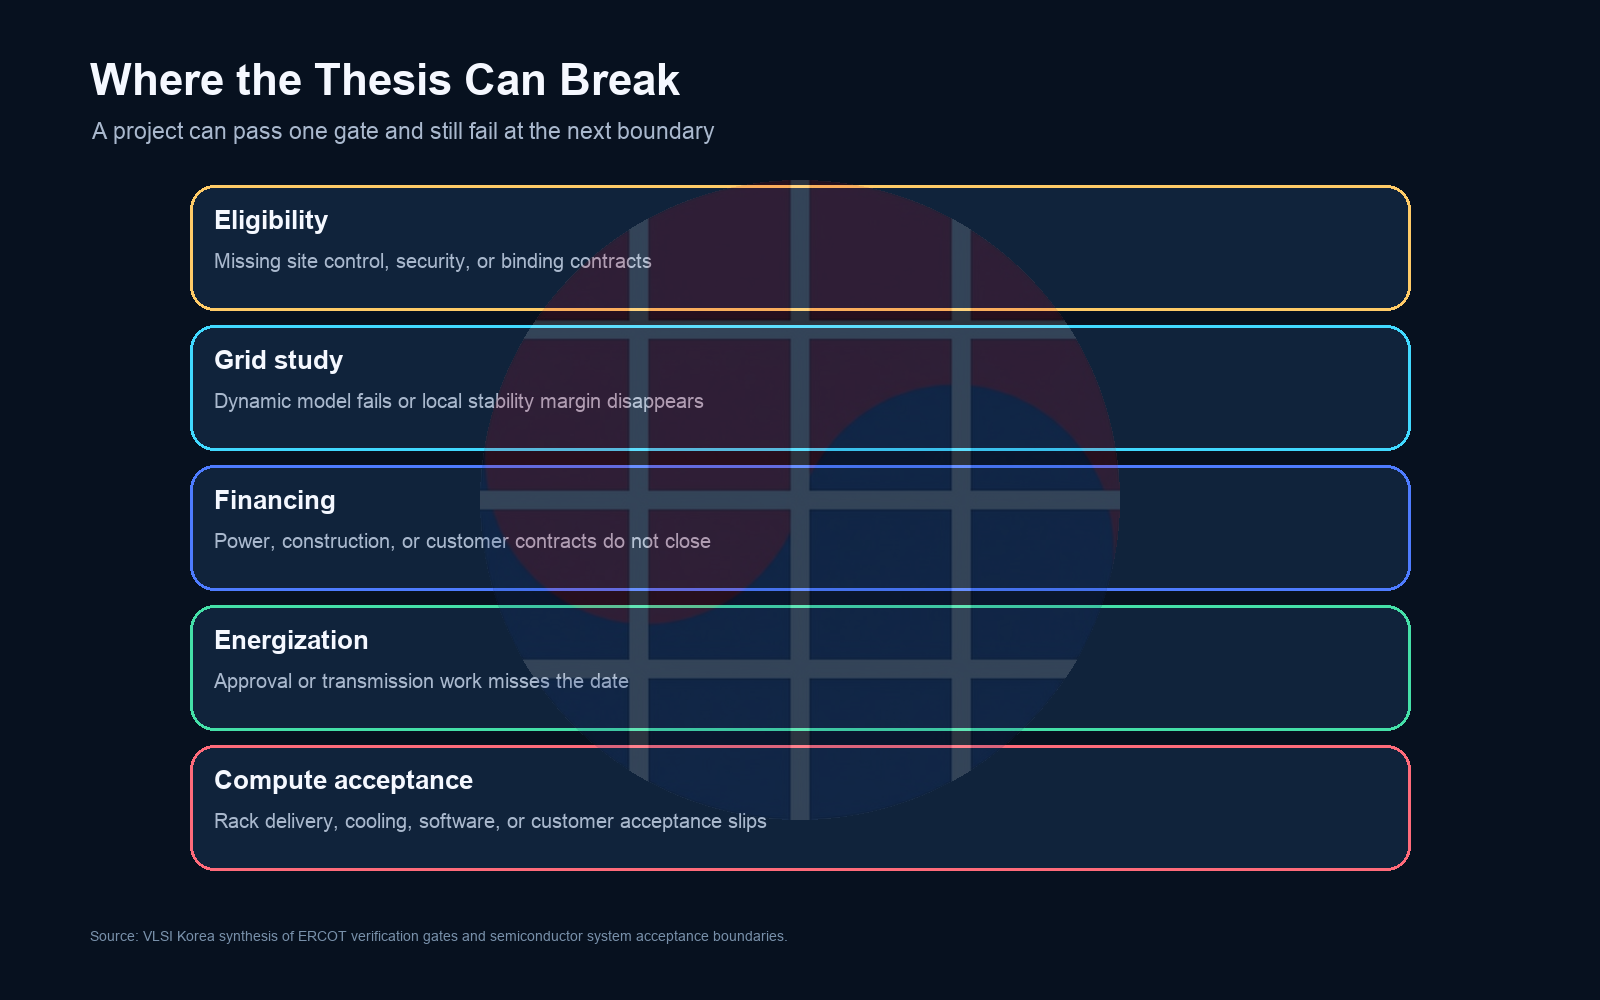
The first gate is eligibility. A project must provide the evidence required by its route, which can include site control, the qualifying study path, financial security, binding contractor evidence, and end-use customer confirmation. ERCOT's August 20 presentation separates attestations, disclosures, evidence, forms, TSP or DSP sign-off, and inspection. A developer statement and third-party confirmation are not counted as equivalent proof.
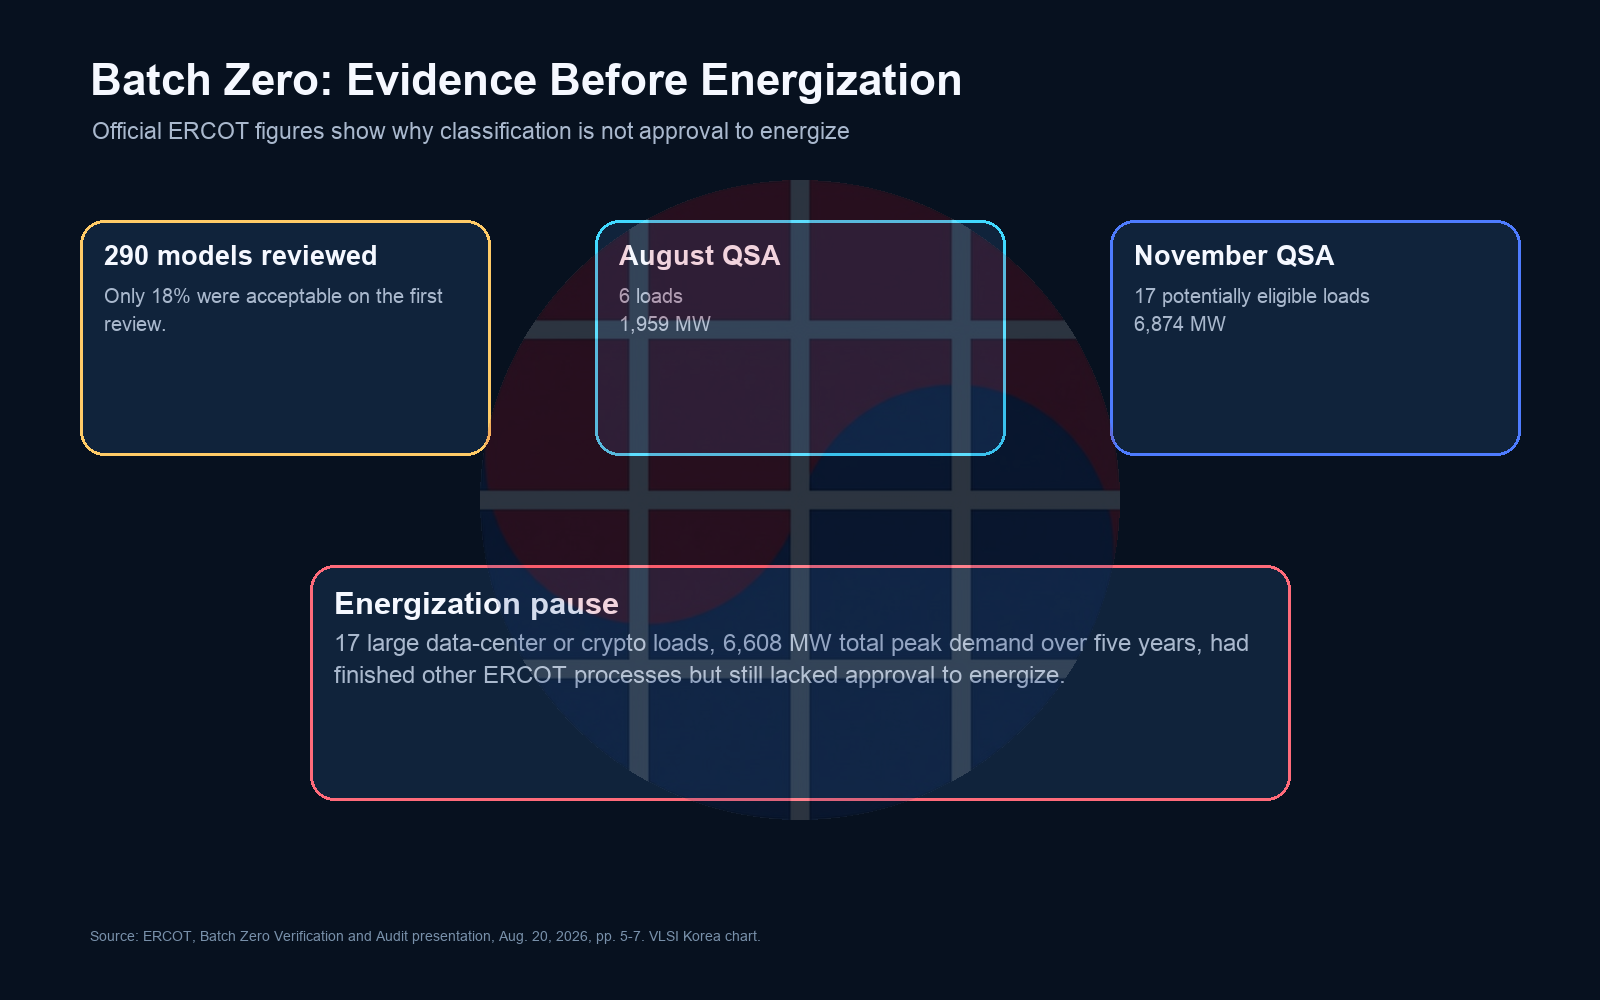
The second gate is dynamic-data review. ERCOT said it had reviewed 290 dynamic models and found approximately 18% acceptable on the first review. This does not mean the other 82% were permanently rejected. Deficiency notices and a 24-day cure period exist. It does show that a data-center load cannot be represented adequately by nameplate megawatts alone. Voltage sensitivity, protection, ride-through, ramping, and control behavior belong in the stability model.
The third gate is the Quarterly Stability Assessment. ERCOT expected six loads representing approximately 1,959 MW in the August 1 QSA and described seventeen loads representing approximately 6,874 MW as potentially eligible for the November 1 QSA. The decisive sentence is that QSA inclusion does not by itself authorize energization. Advancement in a study queue and permission to take power from the grid are different states.
The fourth gate is verification and inspection. ERCOT sends requests for information, reconciles provider and developer records, reviews supporting documents, and can conduct site verification for loads with near requested energization dates. It must offer an opportunity to explain inconsistencies, but loads that fail verification or do not respond can be disqualified from Batch Zero. Site control, long-lead equipment, notice to proceed, end-use customer evidence, permits, contractors, and financial security are different proof objects.
The fifth gate is approval to energize. ERCOT said seventeen large data-center or crypto loads, representing 6,608 MW of total peak demand over five years, had finished other ERCOT processes but had not received approval to energize. The figure shows why an “almost complete” narrative can still stop at the final grid gate. Semiconductor accounting has the same structure: fab output, packaged units, shipped systems, and customer acceptance are not one denominator.
3. The Queue-to-Revenue Evidence Ladder
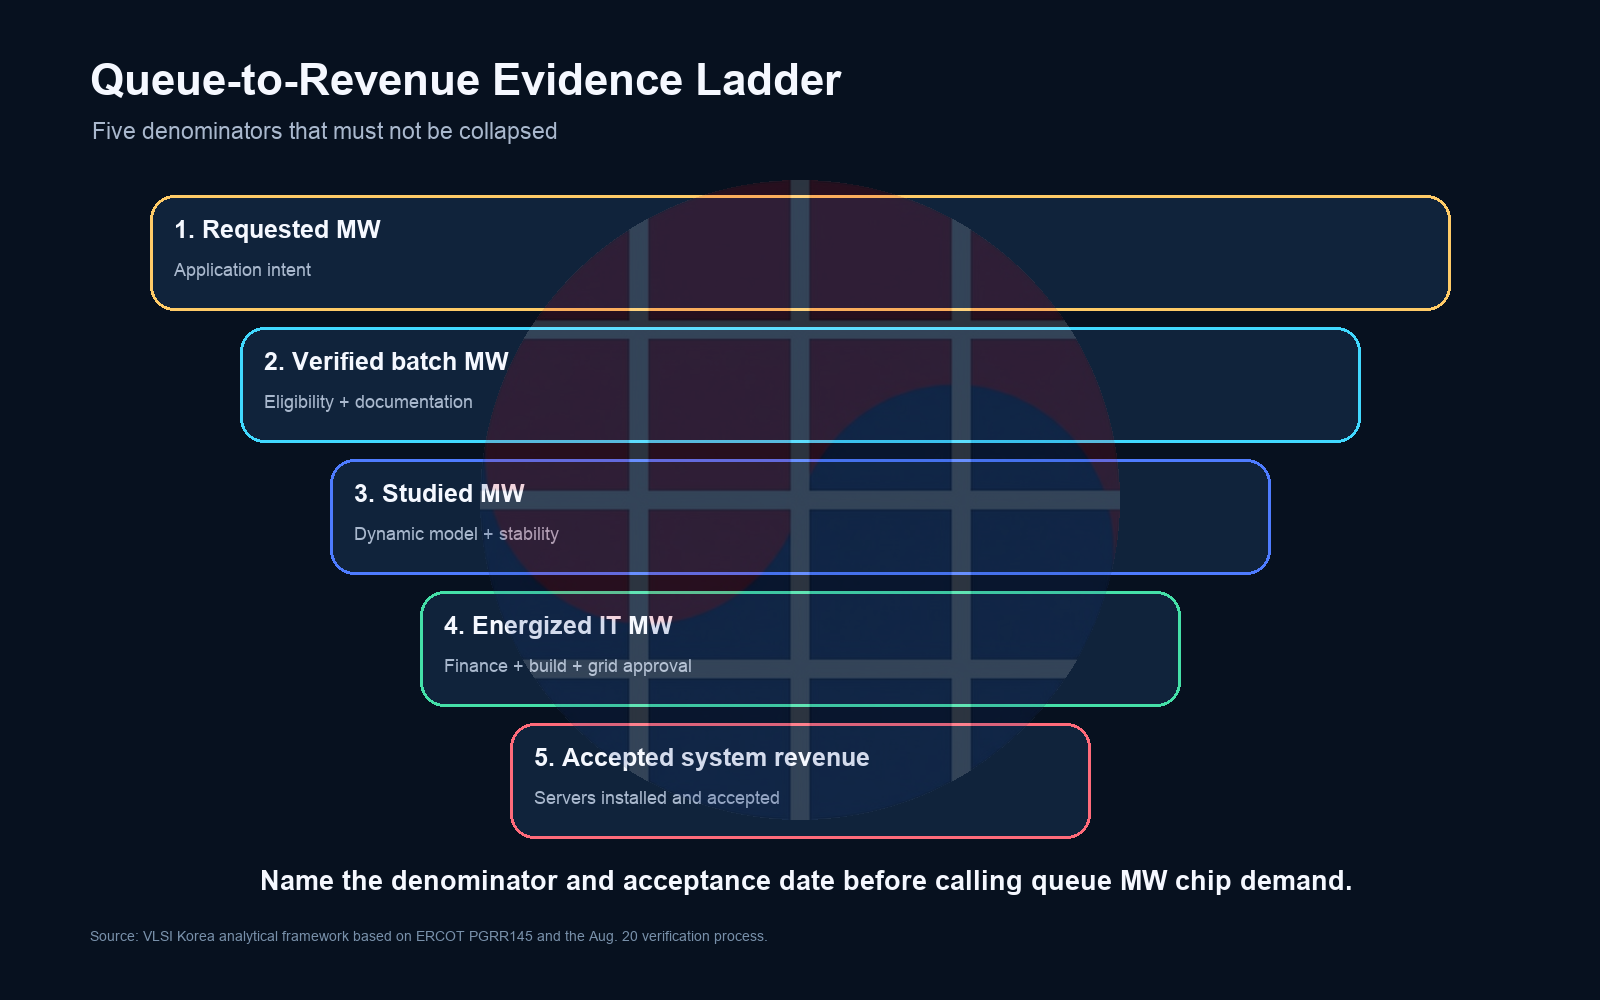
This article proposes the Queue-to-Revenue Evidence Ladder. Stage 1 is requested MW. It is useful for discovery and upper-bound capacity planning, but it does not state build probability. Stage 2 is verified batch MW. Only projects that close eligibility documents and institutional confirmation remain. Stage 3 is studied MW. Dynamic models and stability assessments define technical conditions for connecting to the grid.
Stage 4 is energized IT MW. Financing, transmission work, substations, site construction, cooling, local permits, and electrical approval must close. Stage 5 is accepted system revenue. Servers, accelerators, memory, networks, and storage must be installed, and software bring-up, thermal qualification, and customer acceptance must connect chip shipment to durable revenue and utilization.
The owner and clock change at every stage. ERCOT and transmission or distribution providers own grid evidence. Developers and lenders own land, contract, security, and construction evidence. Hyperscalers and OEM or ODM teams own rack, power, cooling, network, software, and acceptance evidence. Semiconductor suppliers own wafers, packages, boards, firmware, and system qualification. Treating one owner's milestone as the next owner's completion creates timing error.
A defensible demand model can be written as: expected live IT MW equals requested MW multiplied by eligibility probability, study-clearance probability, financing-and-build probability, energization probability, and IT-load share. Converting that result into semiconductor units requires workload mix, rack density, accelerator or CPU power, redundancy, utilization, spares, refresh, and acceptance timing. Setting an unobserved factor to 100% creates false precision.
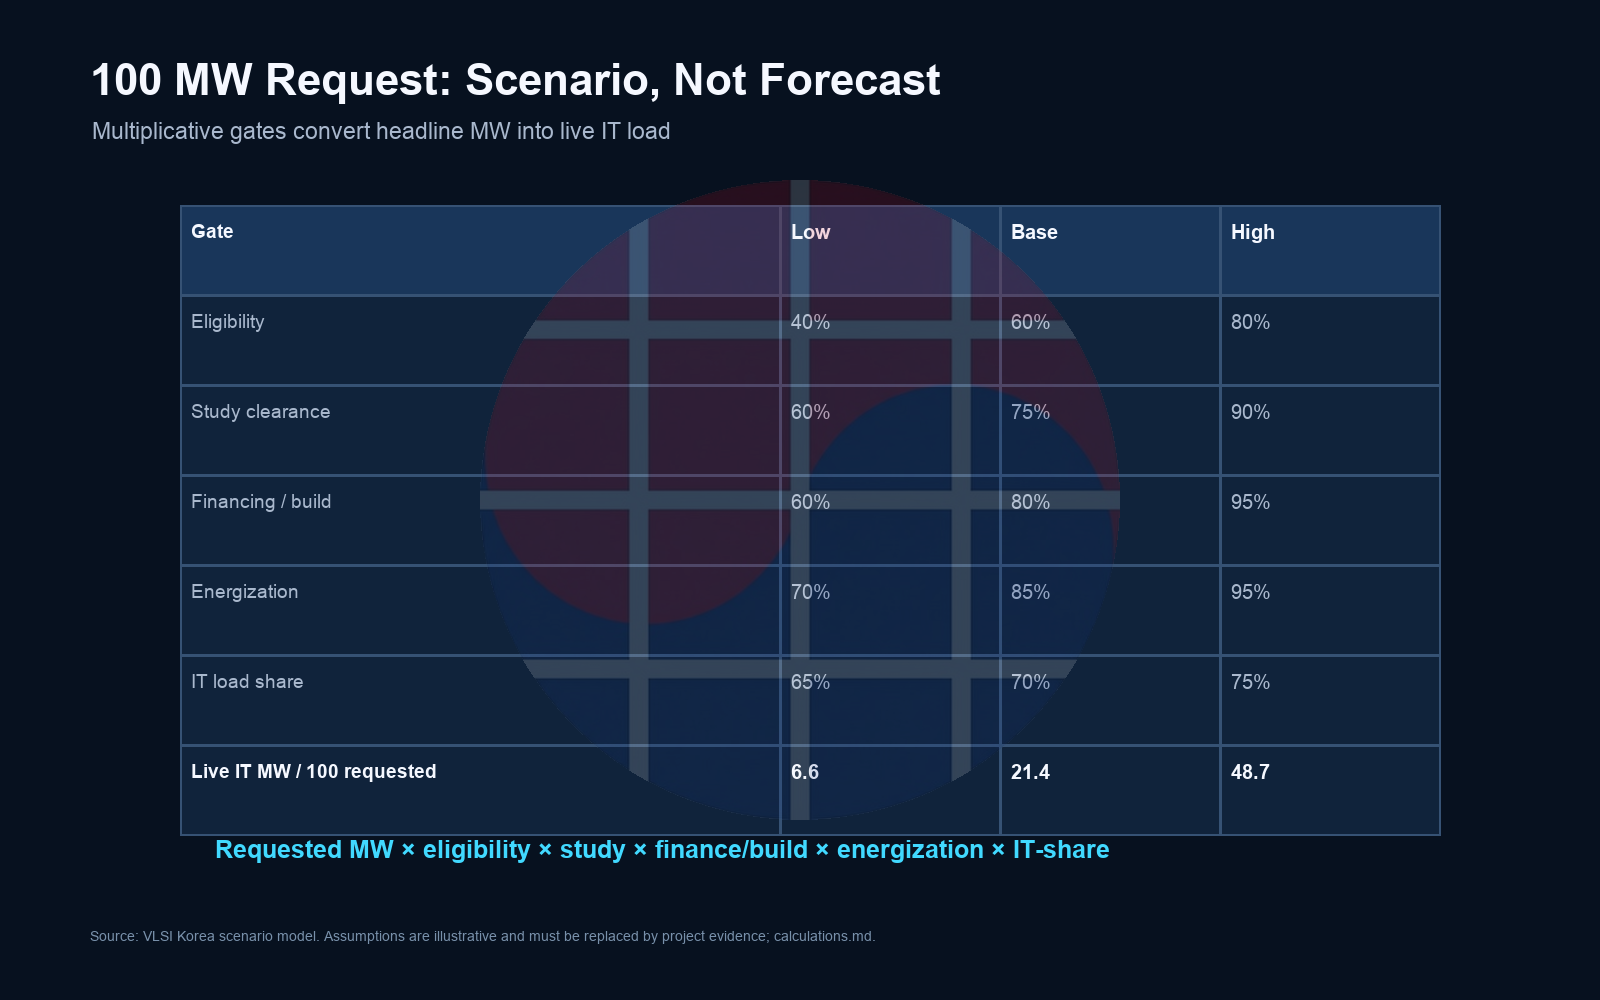
The example applies low, base, and high factors to a 100 MW request. The low case uses 40% eligibility, 60% study clearance, 60% financing and build, 70% energization, and 65% IT-load share, yielding 6.6 MW. The base case uses 60%, 75%, 80%, 85%, and 70%, yielding 21.4 MW. The high case uses 80%, 90%, 95%, 95%, and 75%, yielding 48.7 MW. This is not an estimate of Texas project outcomes. It is a sensitivity tool showing how multiplicative gates can shrink a headline.
The strongest counterargument is that the queue can indicate direction and infrastructure scarcity even when it is not a forecast. That is correct. Growth from 438 GW to 474 GW, the 89% data-center share reported in June, and NERC's computational-load standards work all support the structural importance of power-constrained compute. Directional relevance does not establish shipment timing. Capacity reservations, long-lead procurement, and quarterly revenue guidance need stage-specific denominators.
Boundary condition: The low, base, and high cases are explanatory scenarios. If a project's contracts, study result, financing, construction progress, and IT design are not public, the factors must not be presented as observations.
4. Grid dynamic models and semiconductor qualification share a structure
ERCOT requires dynamic models because a modern data center is not a simple static resistance. UPS systems, power conversion, motors, cooling, protection, control firmware, and workload schedulers operate together. A large load that simultaneously reduces or recovers during a voltage or frequency event can create a new bulk-system transient. NERC similarly says emerging computational loads can have electrical behavior that is distinctive and less predictable than conventional loads.
The NERC Large Loads Action Plan placed computational-load registry criteria and foundational standards out for comment beginning August 19, 2026. Proposed CLO-001-1 covers interconnection, studies, and modeling; CLO-002-1 covers operational data and communications; CLO-003-1 covers protection coordination and disturbance monitoring. These are reliability contracts, not chip-demand forecasts. They are nevertheless upstream acceptance conditions for semiconductor deployment.
The structure repeats inside a rack and package. A power-delivery network must survive voltage droop and transients while accelerators, HBM, CPUs, NICs, and firmware coordinate power states and workload spikes. A grid dynamic model validates aggregate site behavior. Board and package models validate electrical and thermal behavior at far shorter time scales. The owners and scales differ, but a false static assumption can fail the complete system in both cases.
The hard part is interface ownership. During a grid event, who owns load-shed commands, ride-through, restart sequence, and telemetry accuracy? During a rack event, who owns power caps, thermal throttling, link retraining, memory errors, and firmware rollback? If the contract is ambiguous, every subsystem can pass its local test while the full system fails acceptance.
Failure modes form a chain. A project can pass eligibility and still need a dynamic-model cure. It can pass study and miss transmission work or permitting. It can energize and still delay rack acceptance because cooling, networking, or software is incomplete. A ready rack can still wait for accelerator, HBM, package yield, or firmware. “Power available” and “chip revenue visible” are separated by at least one system-acceptance layer.
5. The timing bridge from verification to revenue
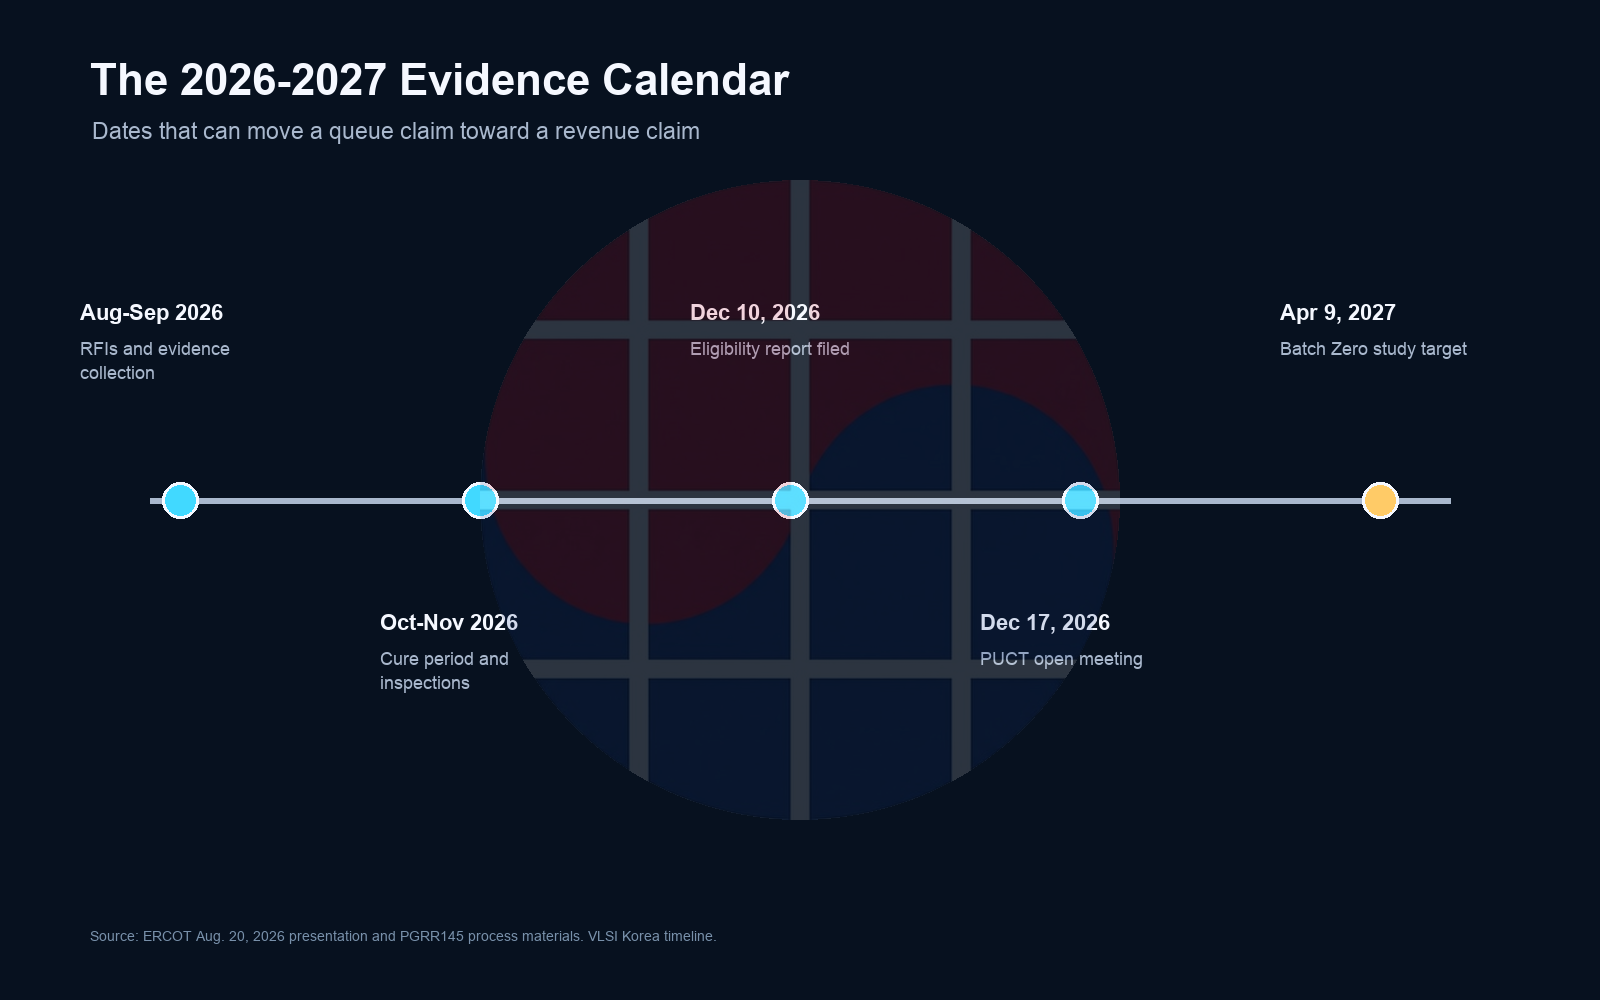
Requests for information and evidence collection run through August and September 2026. The actionable signal is not another total-request number. It is response completeness, eligibility path, the population selected for site verification, and dynamic-data deficiencies. Project count and megawatts should be tracked together, with care for multiple submissions around one site or service territory.
Additional RFIs and cure work continue through October and November. Cure success, inspection results, and provider confirmation create a verified denominator. ERCOT planned to file the Batch Zero Eligibility Verification Report and Community Impact Review Report on December 10, followed by a December 17 PUCT open meeting. Verified classification still does not equal energization or server acceptance.
The presentation sought to preserve the April 9, 2027 Batch Zero study target, while also saying the full impact of the delay was not known. A schedule change must change the demand-timing model. If long-lead transformers, substations, transmission upgrades, cooling equipment, generation, or backup design sit on the critical path, chips can be ready before the site is ready to accept them.
Capital owners need a milestone-to-cash bridge. Track requested MW, verified MW, studied MW, contracted rack MW, energized MW, installed IT MW, and accepted system revenue by quarter. Semiconductor suppliers should separate purchase orders from non-cancellable commitments and connect customer-acceptance clauses to the deployment site's power date. When comparing public-company guidance, normalize the definitions of order, backlog, shipment, and revenue recognition.
6. Korea Lens: decisions for HBM, foundry, OSAT, power, and EDA
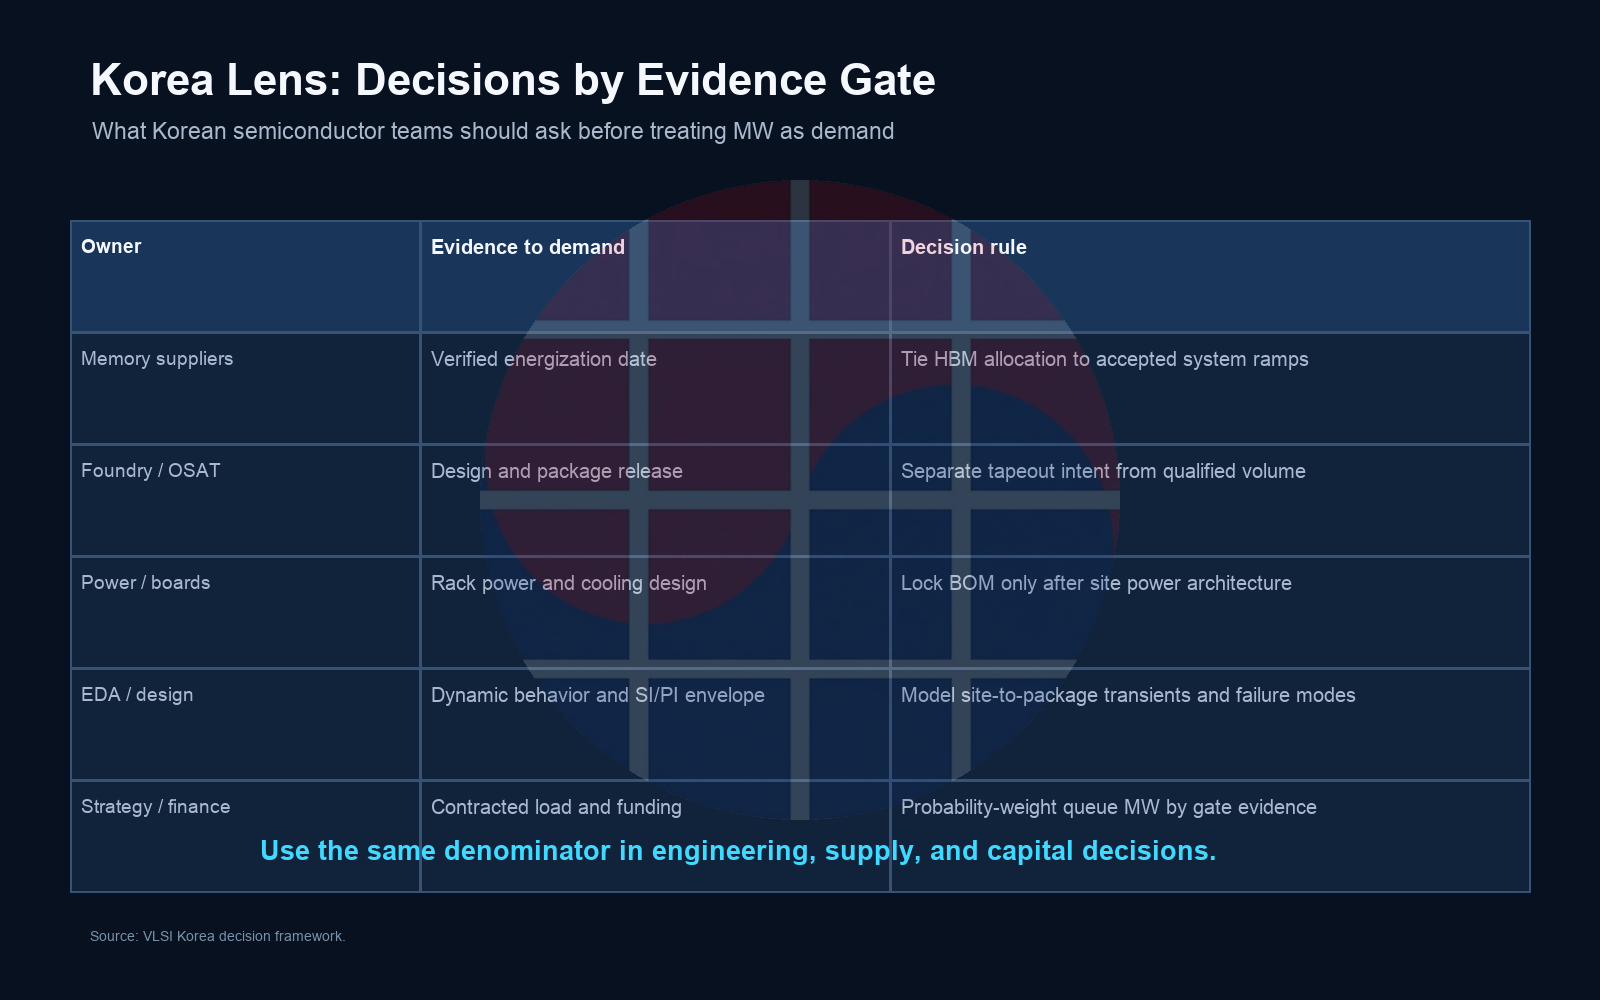
Memory suppliers such as Samsung Electronics and SK hynix should require a verified energization date and an accepted accelerator platform before translating a large-load queue into HBM volume. Allocation evidence strengthens when the system vendor, HBM generation, package release, customer acceptance, and deployment quarter connect. If the site slips, the supplier must know whether inventory accumulates at the chip company, OEM, ODM, or cloud operator.
Foundries and OSATs should separate tapeout intent from qualified volume. A data-center project in a grid queue does not prove that its accelerator taped out or its package qualified. Foundry wafer starts connect to mask release, design sign-off, yield learning, advanced-packaging capacity, substrates, and test. OSAT demand connects to rack power architecture, cooling method, board release, and high-volume test time.
Power-semiconductor, board, connector, and cooling suppliers may be able to use grid evidence earlier. Once the substation and rack architecture are fixed, voltage class, conversion topology, redundancy, busbars, connectors, and thermal solutions become more specific. They should still avoid multiplying site MW directly by a component bill of materials. Phases, utilization, redundancy, spares, and the acceptance schedule remain separate factors.
EDA and design teams need a site-to-package ownership map for transients. Grid disturbances, UPS transfer, rack power caps, accelerator power states, HBM traffic, and network retries overlap across time scales. This does not require one simulator to model everything. It requires each boundary to name its model owner, valid inputs, correlation point, pass or fail limit, and escalation path.
Strategy and finance teams should replace one haircut on 474 GW with stage-specific probabilities and evidence dates. Update eligibility probability from documentation and audit, study probability from dynamic models and QSA, build probability from financing and contractors, energization probability from grid work and approval, and semiconductor conversion from workload and platform acceptance. A base case becomes more useful when readers can see which factor changed.
Thesis breaker: If December verification data and the 2027 study show high conversion, and independent project evidence repeatedly aligns power dates with server acceptance, this article's conservative weighting is too low. If eligibility, QSA, financing, or energization suffers a material delay, the 474 GW headline remains weak evidence for semiconductor timing.
Practitioner checklist: 1) Is the MW requested, verified, studied, or energized? 2) Are provider, developer, and customer evidence separated? 3) Is dynamic-model and cure status known? 4) Are financing, contractors, site control, and long-lead equipment verified? 5) Are energization and rack-acceptance dates separate? 6) Is the HBM, logic, package, and board bill of materials platform-specific? 7) Are scenario factors clearly labeled instead of presented as observations?
September 18, 2026: watch the outcome of NERC's computational-load registry and proposed-standards comment period. December 10, 2026: measure how the ERCOT eligibility report changes project and MW denominators. December 17, 2026: check PUCT treatment of classification, community impact, and energization conditions. April 9, 2027: compare the Batch Zero study target with the actual schedule. June 30, 2027: compare installed IT MW and accepted server ramps with semiconductor shipment timing for verified projects.
The conclusion is simple. The 474 GW queue is an evidence backlog, not a unit count for an AI-chip supercycle. Batch Zero's value is not that it suppresses large-load ambition. It separates request, eligibility, study, energization, and acceptance so the clock and denominator for semiconductor demand become more accurate.
Sources and method
- ERCOT, PUCT Approves Batch Zero Process, June 18, 2026.
- ERCOT Large Load Integration, current process and submission materials, opened August 30, 2026.
- ERCOT Market Notice M-A080326-01, August 3, 2026.
- ERCOT Batch Zero Verification and Audit presentation, August 20, 2026.
- ERCOT Market Notice M-A080326-02, August 21, 2026.
- Office of the Texas Governor, Comprehensive Data Center Audit directive, August 3, 2026.
- NERC Large Loads Action Plan, current actions and proposed computational-load standards, opened August 30, 2026.
- VLSI Korea Weekly Silicon, August 26, 2026, discovery trigger only and not counted as a primary source.
AI assistance note: AI tools supported public-source discovery, arithmetic verification, bilingual consistency checks, visual drafting, and copy editing. VLSI Korea editorial review remains responsible for the thesis, source interpretation, uncertainty labels, and publication decision. The low, base, and high calculations are transparent scenarios, not forecasts.
This article is provided for informational purposes only and does not constitute a recommendation to buy or sell any security. Figures and factual statements are based on publicly available sources, including company filings, news reports, and market research, and may contain errors in the source material or in the preparation of this article. The author may own shares in companies mentioned. All investment decisions and their outcomes are the reader's responsibility.