VLSI Korea
Intel Q3 Earnings in 6 Days: 5 Things to Check (18A, Foundry, Gross Margin)
Intel reports Q3 on October 29 after the US close. Five checks before the print: the 42% gross margin guide, the 18A ramp, external foundry revenue of USD 293M, PC demand under supply limits, and 14A customer commentary.


Intel reports Q3 results on October 29 after the US market close. The headline numbers sit near the top of guidance, and the real verdict will come from the 42% gross margin guide, the 18A ramp, and the trajectory of external foundry revenue.
30-Second Summary
- Timing: Thursday, October 29, 2026, after the US market close, with the conference call at 17:00 ET. This article is a preview based on guidance and consensus, not reported results.
- Consensus is adjusted EPS of USD 0.39 on revenue of USD 16.45B. Company guidance is revenue of USD 15.8–16.8B, adjusted EPS of USD 0.38, and a gross margin midpoint of 42%.
- The prior quarter raised the bar. Q2 revenue was USD 16.13B and adjusted EPS was USD 0.42, well above the USD 0.21 consensus; adjusted EPS a year earlier was USD -0.10.
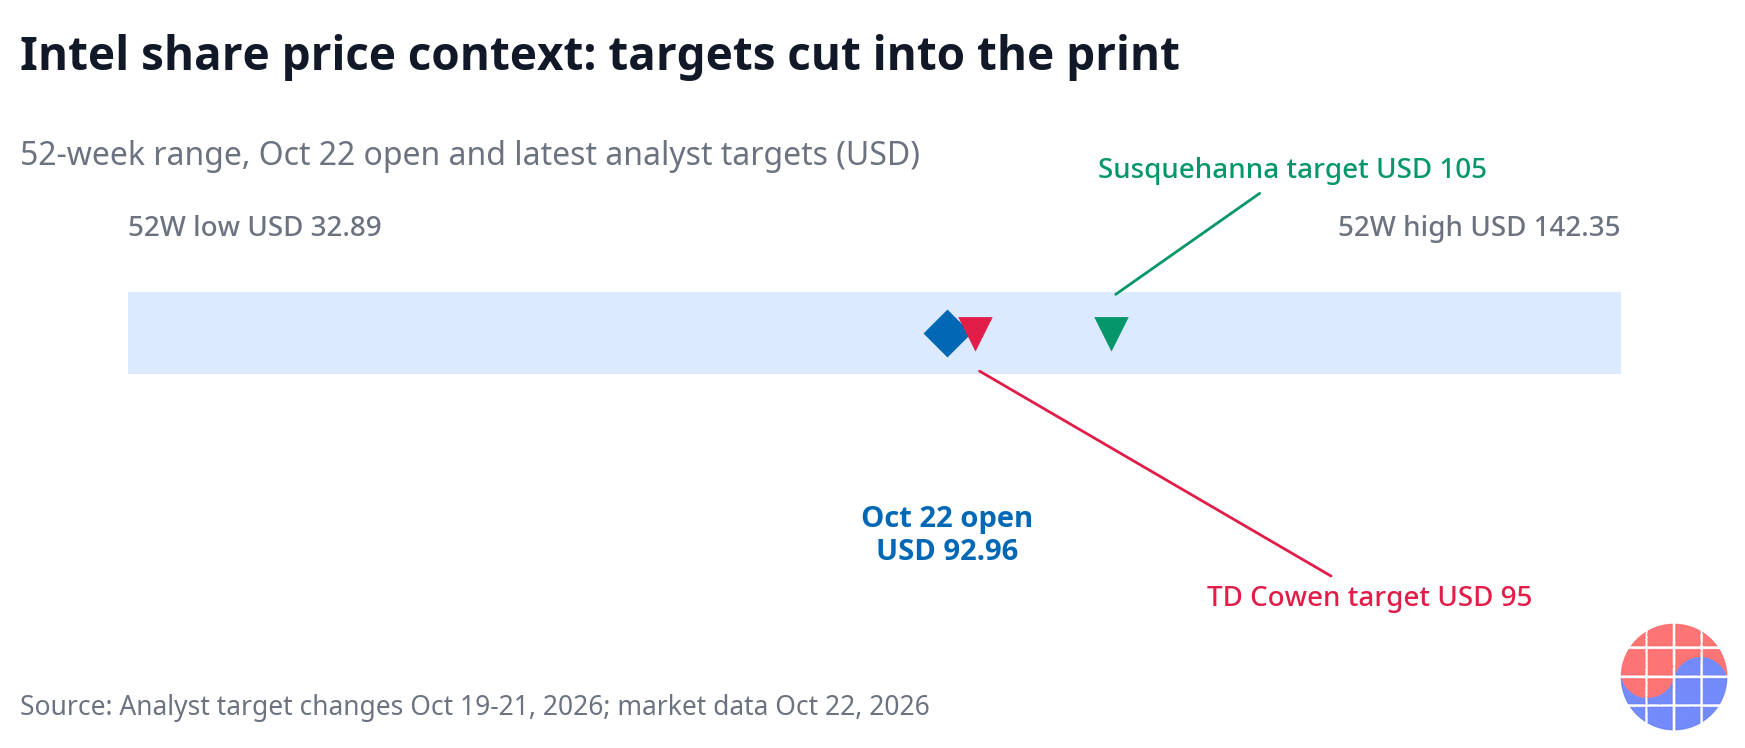
- The stock tensed up first. Shares fell about 5% intraday on October 22, opening at USD 92.96 with a market cap of about USD 468.9B. The 52-week range is USD 32.89–142.35.
- Analysts cut targets into the print. Susquehanna lowered its target to USD 105 on October 21, and TD Cowen lowered its target to USD 95 on October 19.
Background
Intel's turnaround story has spent several quarters deferring proof to "next quarter." Q2 broke that pattern once. Revenue of USD 16.13B and adjusted EPS of USD 0.42 doubled the USD 0.21 consensus, and against USD -0.10 a year earlier, the direction of the profitability recovery was confirmed. The question now is what Q3 has to show on top of that higher base.
The Q3 setup is simple. The midpoint of the USD 15.8–16.8B revenue guidance range is USD 16.3B, and consensus revenue of USD 16.45B sits above that midpoint. In other words, the market has already priced in the upper half of the guide. EPS is the same story: consensus of USD 0.39 sits on top of the guided USD 0.38, so merely "meeting guidance" is not enough — landing at or above the top end is the effective hurdle.
The share price adds tension. The stock once reached a 52-week high of USD 142.35, opened October 22 at USD 92.96, and fell about 5% intraday a week before the print. Two target cuts in the week before earnings carry the same signal: the market is discounting the explanation after the numbers — 18A, foundry, and the Q4 outlook — more than the numbers themselves.
Management's pre-earnings commentary cuts both ways. Demand exceeds supply and the company talked about further production increases into year-end, but it also warned that shortages of components such as memory could limit PC shipments. In a quarter where strong demand and constrained supply coexist, whichever force shows up in the numbers decides the stock's direction.
The 5 Checks
1. Does the 42% gross margin guide hold?
The first checkpoint this quarter is not revenue — it is gross margin. The company guided to a Q3 gross margin midpoint of 42%. Early in an 18A ramp, depreciation and yield costs normally pressure margins, so holding 42% would be the first evidence that the ramp sits inside a controlled cost envelope. Conversely, if gross margin misses 42%, the market is likely to interrogate the cost structure even if revenue beats consensus. What matters is not only the number itself, but whether management explains any miss or beat as one-off or structural.
2. Is the 18A production ramp confirmed in numbers again?
Intel Foundry's 18A production has been reported at 25% above target. What this print needs to show is whether that ramp is confirmed again in quarterly figures, and whether commentary on yield becomes more specific than before. Because 18A is the starting point for both Intel's product roadmap and its external foundry business, a single line of production commentary moves the credibility of both businesses at once. The tell is whether "above target" phrasing repeats, or converts into concrete production scale and timing.
3. Does external foundry revenue bend upward from USD 293M?
External foundry revenue was most recently reported at about USD 293M. In absolute terms that is under 2% of Intel's USD 16B-plus quarterly revenue, but the meaning of this number is direction, not size. If external customer revenue stalls, the foundry is still read as an internal-volume business; if a growth trajectory is confirmed, the "customers have started paying" narrative takes hold. This quarter, watch the change in the number together with any commentary on new customers or expanding volumes.
4. Did PC demand actually convert into shipments under supply constraints?
Management said demand exceeds supply, but attached a caveat: shortages of components such as memory could limit PC shipments. There are two things to check. First, whether client-segment revenue supported the consensus-level total. Second, whether component shortages were an actual constraint on Q3 results, or whether they were pushed into the Q4 guidance discussion. The same "component shortage" reads completely differently depending on whether it is already inside this quarter's numbers.
5. Does 14A customer commentary advance a step?
14A targets risk production in the second half of 2027. With that much runway left, what matters in this print is not technical specifications — it is customers. The checkpoint is whether customer-engagement commentary stays at the "in discussions" level or is expressed as concrete progress. In a period when external variables — from government-backed semiconductor alliances to large customers' outsourcing deliberations — intersect with foundry strategy, 14A customer commentary drives the foundry's medium-term valuation. Silence is also an answer.
Business Deep Dive
Start with the layout of the numbers. The table below places the prior quarter's actuals, company guidance, and market consensus side by side.
📩 Following this story?
Get the follow-up analysis — earnings, reports and HBM supply — in your inbox daily at 10:30 KST. Subscribe free →
| Item | Q2 actual (reported) | Q3 guidance | Q3 consensus |
|---|---|---|---|
| Revenue | USD 16.13B | USD 15.8–16.8B | USD 16.45B |
| Adjusted EPS | USD 0.42 | USD 0.38 | USD 0.39 |
| Gross margin | — | 42% midpoint | — |
| Reference point | Beat USD 0.21 consensus | Midpoint revenue USD 16.3B | Sits in upper part of guide |
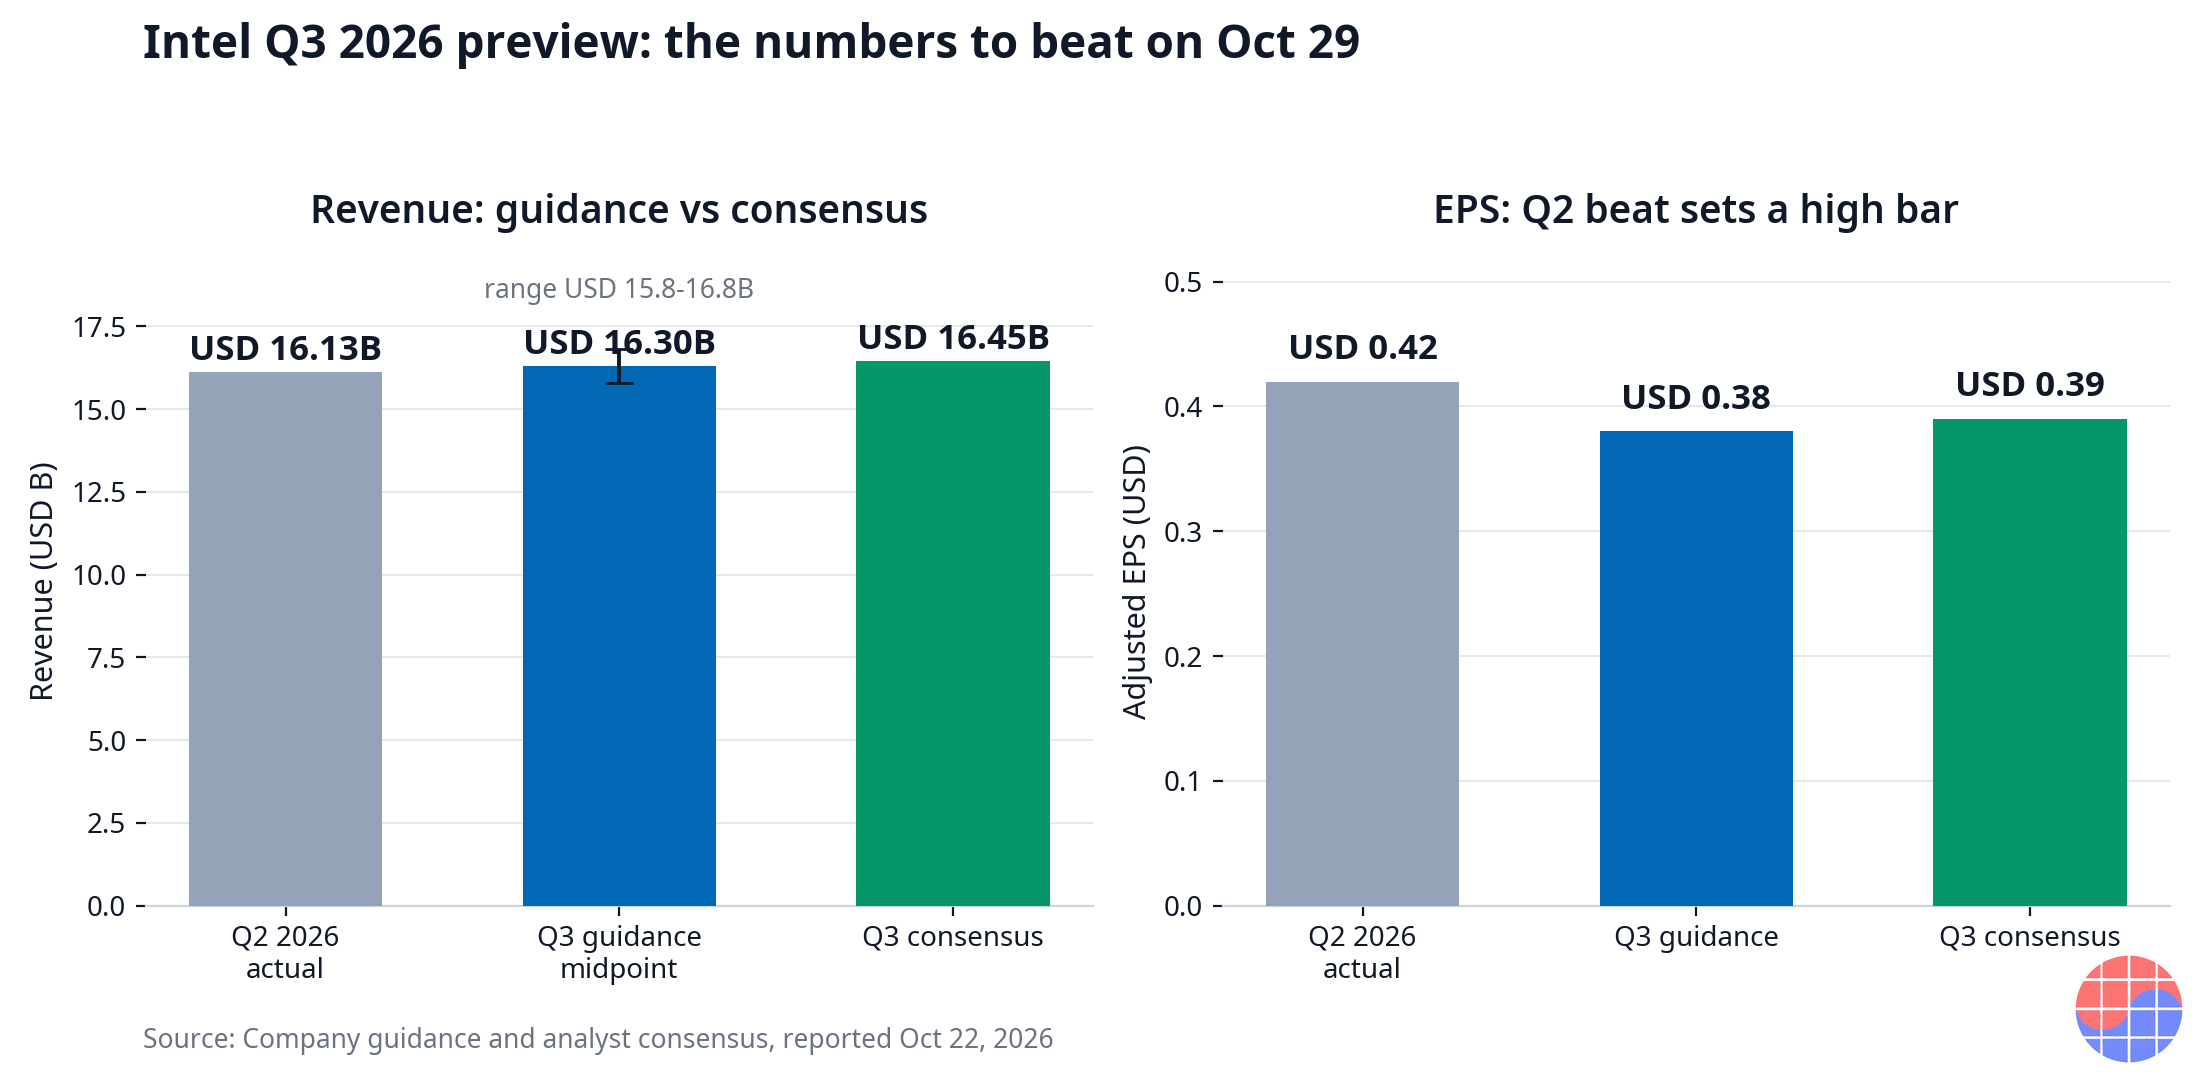
The table's message is clear. Consensus revenue of USD 16.45B is USD 0.15B above the USD 16.3B guidance midpoint, with USD 0.35B of headroom to the USD 16.8B top end. Consensus EPS of USD 0.39 is USD 0.01 above the guided USD 0.38. The market's base case is therefore not "a clean quarter at the midpoint" but "a quarter that hugs the top end." The disappointment threshold has moved down accordingly.
The valuation context matters too. A market cap of about USD 468.9B for a company with quarterly revenue in the USD 16B range prices in a substantial part of the completed turnaround rather than current earnings. With the stock in the lower half of its USD 32.89–142.35 52-week range, the market still does not fully believe that completed form — and that gap is exactly the stage for this earnings print. Two target cuts in the week before the report (Susquehanna to USD 105, TD Cowen to USD 95) show analysts choosing downside risk management over upside chasing.
The foundry's accounting position deserves a note. External foundry revenue of USD 293M is roughly 1.8% of group revenue. Yet the market is sensitive to this number because the foundry is the strategic axis that explains Intel's entire capital allocation. The 18A ramp cost presses on gross margin today, and the only justification for that cost is the growth trajectory of external customer revenue. That is why checkpoints 2 and 3 are connected: the ramp is a story about cost, and external revenue is the addressee of the invoice for that cost.
The demand-versus-supply tension also needs numerical sense. Management talks about demand exceeding supply and expanding production into year-end, while naming component shortages as a constraint on PC shipments. When demand is strong but supply is blocked, near-term revenue is capped while pricing and mix are defended. Conversely, the moment component shortages ease, pent-up demand can convert into shipments all at once. Q3's numbers deliver the first verdict on which force actually won.
Chase's Take
The essence of this print is not "has Intel improved" but "how far Intel's burden of proof has travelled." Q2's beat reduced doubt but did not create conviction. With the stock down from its 52-week high and targets being cut ahead of the report, what the market demands is not a beat but continuity of the narrative.
That is why, among the five checkpoints, gross margin ranks first. Revenue and EPS can produce "managed numbers" inside a guidance range, but a 42% gross margin carrying 18A ramp costs passes the reality of process and yield straight through. If that number holds, the other checkpoints get room to be read as "in progress." If it breaks, even good news such as above-target 18A production gets retranslated into the language of cost.
On external foundry revenue of USD 293M, stay cold-headed. Until this number bends into double-digit growth, the foundry story remains in the territory of promises. Conversely, because the number is small, even a small increase reads as a trajectory. What Intel has to show this time is not proof of scale — it is proof of direction.
Implications
- For investors: The hurdle is not "beat consensus" but "top of guidance plus defending the 42% gross margin." Meeting only one of the two is likely to produce a half-hearted share reaction. The second reaction — during the 17:00 ET call's Q&A, when 18A and 14A commentary lands — matters more than the first reaction to the headline numbers.
- For the competitive landscape: Confirmation of the 18A ramp reads as a signal that pulls the leading-edge timeline forward. The trajectory of external foundry revenue connects directly to large customers' deliberations on diversifying contract manufacturing.
- From a Korea angle: With component shortages officially cited as a constraint on PC shipments, memory pricing and supply conditions are a hidden variable in Intel's results. For Korea's memory industry, Intel's shipment commentary acts as a thermometer for PC demand.
- Next on the calendar: After this print, Q4 guidance and execution of the year-end production increase become the next quarter's checkpoints. Until the 14A risk production target in the second half of 2027, the pace of customer commentary will set the pace of the medium-term story.
FAQ
Q1. When does Intel report Q3 earnings?
Intel reports on Thursday, October 29, 2026, after the US market close, with the conference call at 17:00 ET the same day. This article is a preview based on guidance and consensus published before the results; it is not a report of confirmed figures.
Q2. What numbers does the market expect for Q3?
Consensus is revenue of USD 16.45B and adjusted EPS of USD 0.39. Company guidance is revenue of USD 15.8–16.8B, adjusted EPS of USD 0.38, and a gross margin midpoint of 42%, so consensus sits in the upper part of the guidance range.
Q3. Why does the 42% gross margin matter more than revenue?
Because 18A ramp costs run through this line, holding 42% shows whether ramp costs are inside a controlled envelope. Even if revenue beats consensus, a broken gross margin invites the market to question the cost structure.
Q4. Why does external foundry revenue of USD 293M get so much attention?
The amount is small — about 1.8% of group revenue — but it is the directional indicator of whether external customers have actually started paying. The interpretation gap between stagnation and a confirmed growth trajectory is large.
Sources
- Intel Stock Tumbles Ahead of Q3 Earnings — TradingView (GuruFocus), October 22, 2026: https://www.tradingview.com/news/gurufocus:643a45819094b:0-intel-stock-tumbles-ahead-of-q3-earnings/
- Intel Projected to Announce Quarterly Earnings on Thursday — American Banking News, October 22, 2026: https://www.americanbankingnews.com/2026/10/22/intel-intc-projected-to-announce-quarterly-earnings-on-thursday.html
Note: This article is a preview based on guidance, consensus, and reporting published before the earnings release; it is not a report of confirmed results and is not a recommendation to buy or sell any security.
📩 Missed today's analysis? Get tomorrow's in your inbox
Daily Silicon at 10:30 KST plus earnings and analyst-report breakdowns, first. Samsung Electronics, SK hynix, TSMC and HBM supply, read by practicing engineers. Join 300+ subscribers.
Subscribe free →
Free · No spam · Unsubscribe anytime