VLSI Korea
Two-Thirds of the Chip Market Now Belongs to 10 Companies (NVIDIA, Memory)
The top 10 chip companies took USD 562.1B of the USD 831B semiconductor market in 2025: 67.6%. NVIDIA at 18.1%, the memory makers' climb, the growers who still lost ground, and a two-year divide of +90% vs +8%.


30-Second Summary
- Global semiconductor revenue reached USD 831B in 2025, up 23.3% year on year, and the top 10 suppliers took USD 562.1B of it — 67.6% of the entire market (industry research firm data, presented October 22, 2026).
- NVIDIA alone posted USD 150.3B in revenue for an 18.1% share, contributing roughly one-third of the industry's total revenue growth.
- The three memory makers (Samsung Electronics, SK hynix, Micron) climbed the ranking, while Intel was the only top-10 company whose revenue fell.
- Over two years, from 2023 to 2025, the industry grew 53%, the top 10 grew 90%, and everyone else combined grew just 8%. Concentration is becoming structure, not a cycle.
Background
Semiconductors used to be a fragmented industry. Memory, logic, analog, power and automotive chips were separate arenas, each with its own champions. AI data-center investment has redrawn that map. What the 2025 revenue figures show is not simply a boom year: the rewards of growth are now compounding at the top far faster than the industry average.
According to figures released on October 22, 2026 by an industry research firm, worldwide semiconductor revenue rose from roughly USD 674B in 2024 to about USD 831B in 2025, a gain of 23.3%. Over the same period, combined top-10 revenue climbed from USD 431.1B to USD 562.1B, up 30.4%. The largest companies grew faster than the market itself, lifting their combined share from about 64% to 67.6% in a single year.
The source of that growth matters. The industry added roughly USD 157B of revenue in 2025, and NVIDIA alone added USD 52.9B of it. Its lead over second-placed Samsung Electronics nearly tripled, from USD 22.3B to USD 64.5B. Memory amplified the shift: the DRAM market expanded from just over USD 50B in 2023 to more than USD 150B in 2025 — roughly a threefold increase, with growth above 50% in 2025 alone. AI servers did not only consume HBM; they also pulled system memory demand, particularly DDR5, sharply higher.
Business Deep Dive
The 2025 Top 10: revenue, share and growth
| Rank 2025 | Rank 2024 | Company | Revenue 2025 (USD B) | Revenue 2024 (USD B) | Growth | Share 2025 |
|---|---|---|---|---|---|---|
| 1 | 1 | NVIDIA | 150.3 | 97.4 | +54.3% | 18.1% |
| 2 | 2 | Samsung Electronics | 85.8 | 75.1 | +14.2% | 10.3% |
| 3 | 4 | SK hynix | 67.2 | 47.2 | +42.3% | 8.1% |
| 4 | 3 | Intel | 48.5 | 50.4 | -3.7% | 5.8% |
| 5 | 7 | Micron | 45.6 | 29.2 | +56.3% | 5.5% |
| 6 | 6 | Broadcom | 39.5 | 30.9 | +28.0% | 4.8% |
| 7 | 5 | Qualcomm | 38.9 | 34.9 | +11.6% | 4.7% |
| 8 | 8 | Apple* | 34.4 | 25.0 | +37.5% | 4.1% |
| 9 | 9 | AMD | 32.7 | 24.5 | +33.4% | 3.9% |
| 10 | 10 | MediaTek | 19.1 | 16.5 | +15.6% | 2.3% |
| — | — | Top 10 total | 562.1 | 431.1 | +30.4% | 67.6% |
| — | — | Total market | c. 831 | c. 674 | +23.3% | 100% |
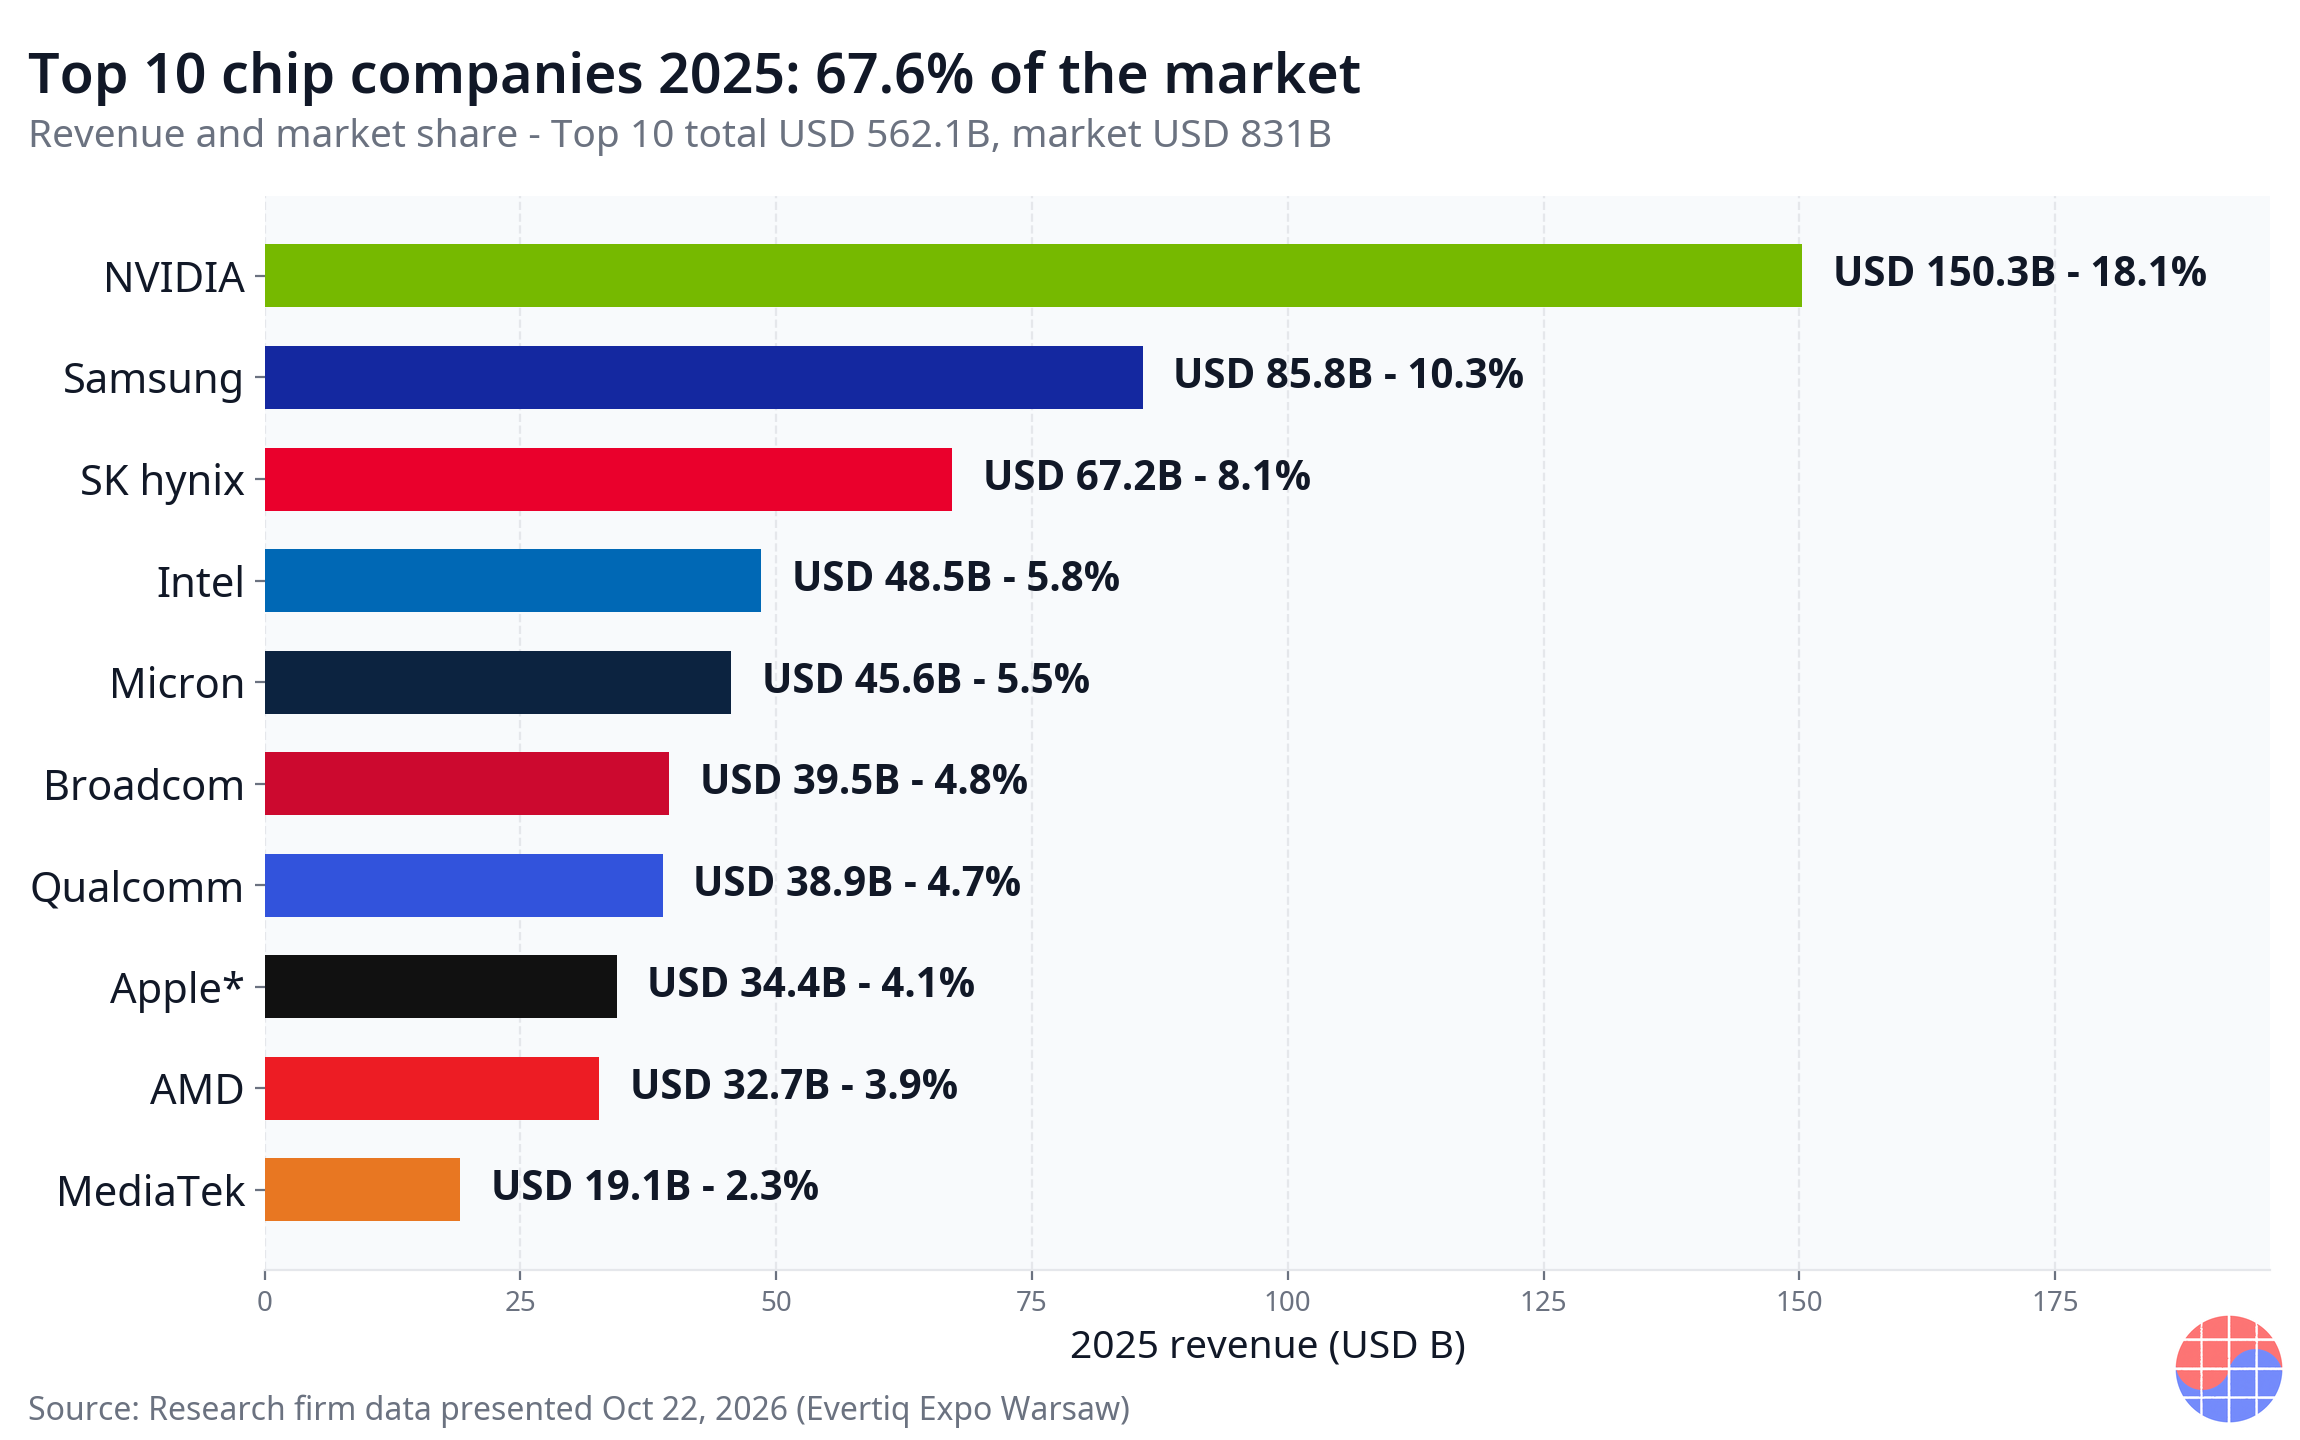
*Apple's figure is the value the research firm assigns to its in-house semiconductor activity, not external chip sales. Source: industry research firm data, presented October 22, 2026.
Memory rewrote the ranking
Most of the movement came from memory. Micron grew fastest in the top 10, at 56.3%, adding USD 16.4B to reach USD 45.6B and climbing from seventh to fifth, passing both Broadcom and Qualcomm. SK hynix grew 42.3% to USD 67.2B and took third place: in 2024 it sat about USD 3.1B below Intel; a year later it stood USD 18.7B above it. The positions of the two companies flipped completely in twelve months.
It is important to read these numbers as revenue, not volume. As manufacturers shift capacity toward HBM and high-capacity server DRAM, supply of other memory types tightens and prices rise beyond HBM as well. Price and product mix explain much of the growth. The memory makers' rise is therefore the product of a single wave — AI demand — and the ranking can move again if that wave recedes.
Growing, and still losing
The sharpest message in the data is that growth no longer equals winning. Samsung Electronics grew revenue 14.2% to USD 85.8B and held second place, but it grew more slowly than the 23.3% market, so its share slipped from 11.1% to 10.3% and its lead over SK hynix narrowed from USD 27.8B to USD 18.5B. Qualcomm is the clearest case: revenue rose 11.6%, yet it fell from fifth to seventh and its share dropped from 5.2% to 4.7%.
The mirror image exists too. Broadcom grew 28.0% and passed Qualcomm, but Micron passed Broadcom, so it stayed sixth. AMD grew 33.4% — faster than both the market and the top-10 average — and still stayed ninth, because Apple grew faster and the gap between them widened from about USD 0.5B to USD 1.7B. Intel was the only top-10 supplier whose revenue declined, down 3.7%, with share falling from 7.5% to 5.8%.
Two years make it structural
| Segment | Growth 2023 → 2025 | Note |
|---|---|---|
| Total industry | +53% | 2025 revenue of about USD 831B |
| Top 10 combined | +90% | 67.6% share in 2025 |
| All other suppliers combined | +8% | Most growth accrued to the top 10 |
| NVIDIA + 3 memory makers | 24% → 42% | Share of industry revenue, 2023 vs 2025 |
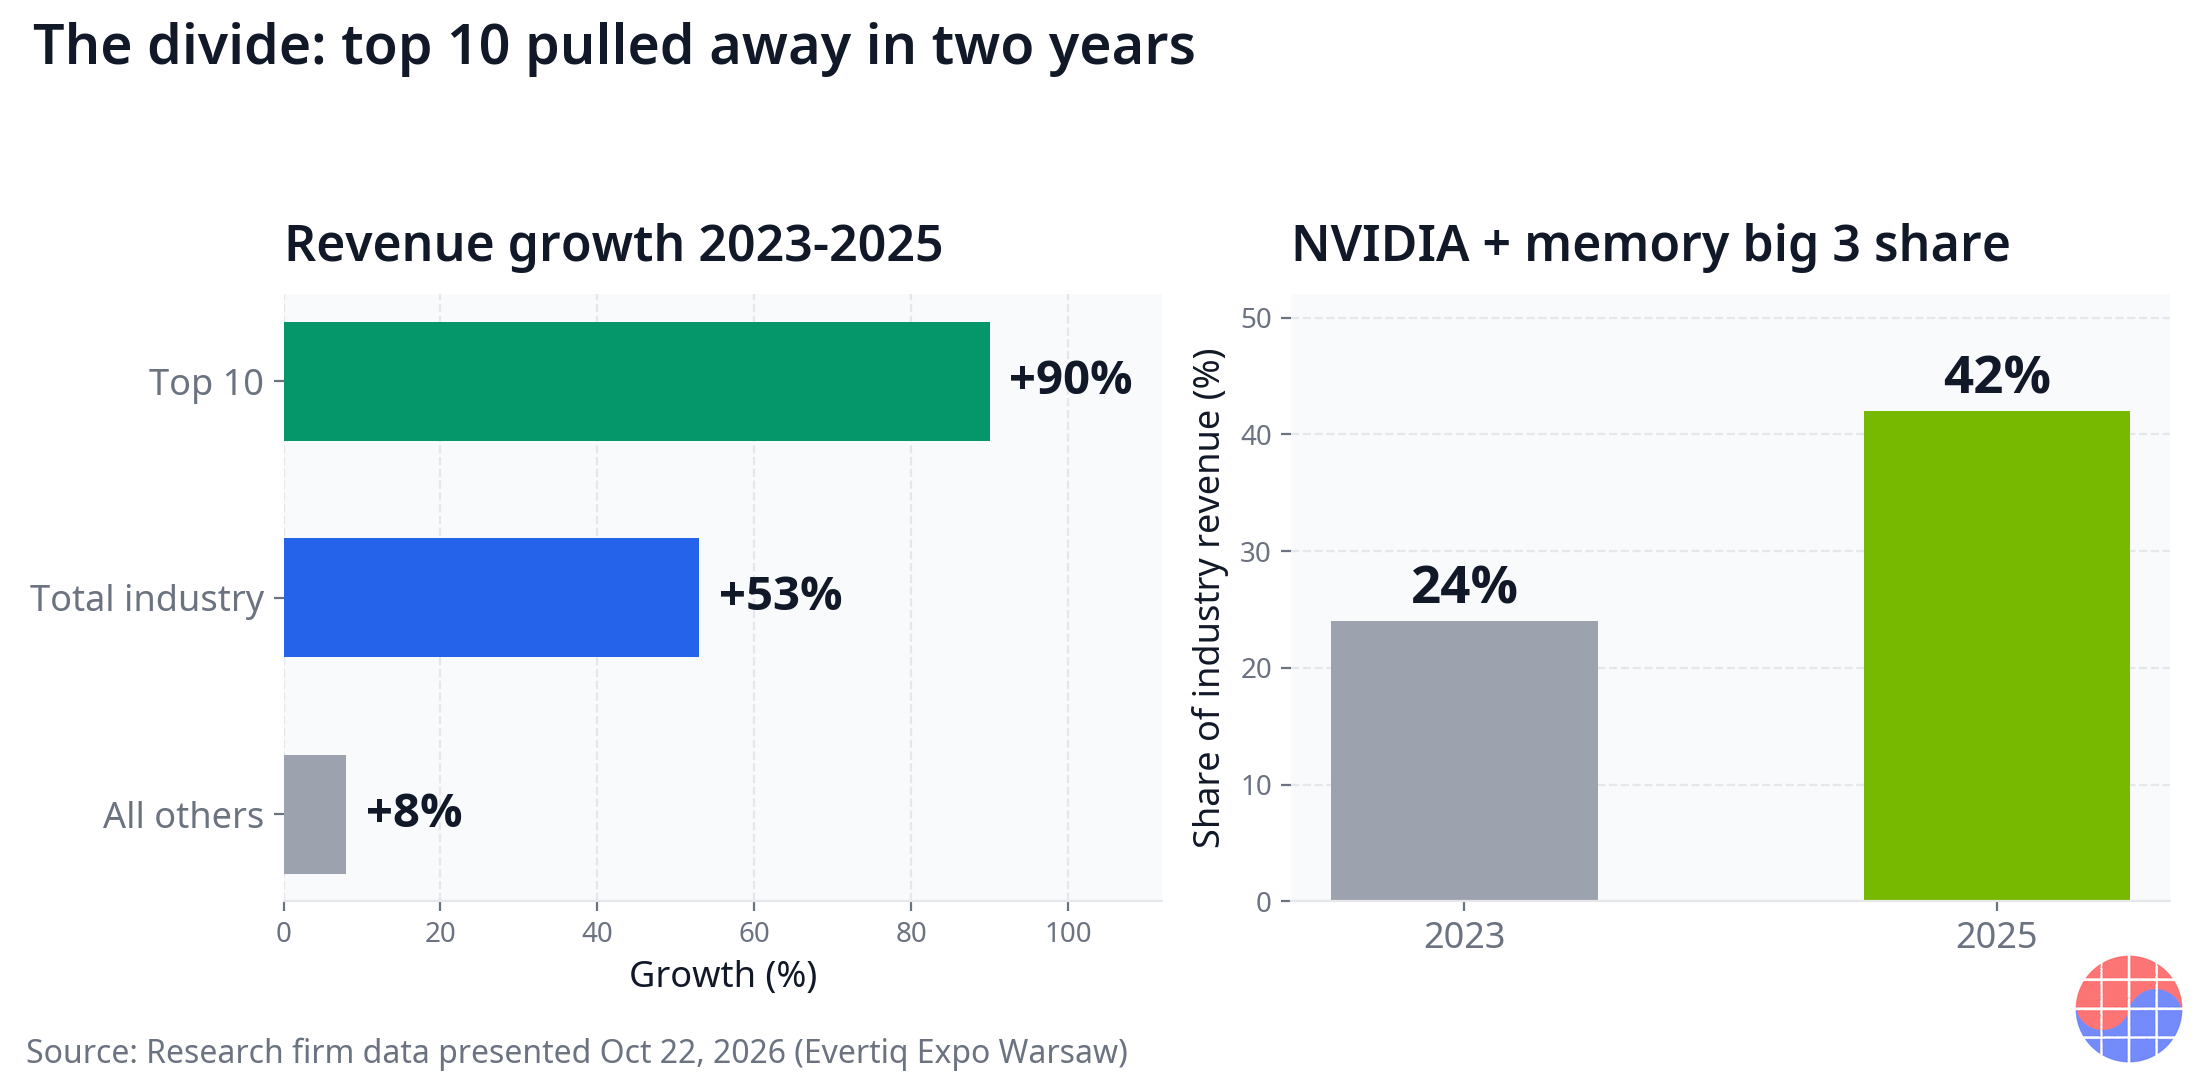
Over a two-year window, concentration looks structural rather than cyclical. While the industry grew 53%, the top 10 grew 90% and the rest of the industry combined managed only about 8%. NVIDIA plus the three major memory makers went from 24% of industry revenue in 2023 to 42% in 2025 — two of every five dollars now land with four companies.
📩 Following this story?
Get the follow-up analysis — earnings, reports and HBM supply — in your inbox daily at 10:30 KST. Subscribe free →
The pace accelerated into 2026. In the research firm's September update, first-half 2026 industry revenue reached USD 752B — already about 90% of the full-year 2025 total. Second-quarter revenue alone passed USD 425B, up more than 31% quarter on quarter, with memory accounting for more than half of the market and DRAM, NAND and NOR all setting quarterly revenue records. Revenue excluding memory still rose by just over 10% sequentially, against a historical second-quarter average of just over 3%. Industry association figures (SIA/WSTS) separately show cumulative 2026 sales through August passing USD 1 trillion for the first time, with a full-year outlook above USD 1.6 trillion — but those figures use a different methodology and are not directly comparable with the numbers above.
Chase's Take
The essence of this concentration is qualification, not just demand. The AI accelerator market is not open to everyone. Only suppliers that pass customer qualification can ship HBM; advanced packaging capacity and the balance sheet to sustain enormous CapEx are entry conditions. Qualification takes time, larger CapEx lowers unit cost, and large customers concentrate volume on proven suppliers. It is a textbook compounding-of-scale structure.
For companies outside the top 10, the problem therefore comes before product competitiveness: it is procurement and priority. As the largest suppliers steer capacity toward HBM and server products, component availability for industrial and automotive markets — markets far removed from AI — becomes a function of a handful of suppliers' investment priorities. The definition of supply-chain risk is changing: the risk is no longer only that a part is discontinued or falls behind technically, but that a buyer falls down a supplier's priority list.
From a Korean perspective, having two memory makers inside the top three is both an opportunity and a concentration risk. Samsung Electronics and SK hynix together hold 18.4% share — roughly equal to NVIDIA alone. But both companies' fortunes hinge on the same variable, AI server memory demand and pricing. Korea's semiconductor portfolio is therefore closer to a concentrated bet than a diversified one: it earns faster than the industry when prices rise, and it can fall faster when they turn.
Implications
- Watch share, not just growth. Several companies posted double-digit growth in 2025 and still lost position. In this market, absolute growth does not describe competitive standing; relative speed against the market average is the real scoreboard.
- The middle of the table has narrowing options. A number two losing share, like Samsung Electronics, or a grower being passed, like Qualcomm, has two realistic options: build direct AI exposure, or carve out a defensible position in niches the top 10 deprioritizes. Broad, unfocused portfolio expansion only dilutes relative speed further.
- Buyers must redesign procurement. Companies purchasing industrial and automotive semiconductors need to revisit long-term agreements, dual sourcing and inventory policy, because a supplier's investment priorities now decide component availability.
- For investors, concentration itself is a variable. A 67.6% top-10 share is evidence of efficiency, but it also means industry earnings move with a few companies' results when the AI CapEx cycle turns. Concentration risk should be priced alongside the premium.
FAQ
Q1. What share of the 2025 semiconductor market did the top 10 companies hold? USD 562.1B, or 67.6% of the roughly USD 831B total market (industry research firm data, presented October 22, 2026), up from a combined share of about 64% in 2024.
Q2. Why did the memory companies climb the ranking? The DRAM market roughly tripled in two years, from just over USD 50B in 2023 to more than USD 150B in 2025. AI servers drove demand not only for HBM but also for DDR5 system memory, and as capacity shifted toward HBM and server DRAM, tighter supply lifted prices and revenue further.
Q3. Which companies grew revenue but still lost ground? Qualcomm grew 11.6% yet fell from fifth to seventh. Samsung Electronics grew 14.2% but saw its share fall from 11.1% to 10.3%, while Broadcom (+28.0%) and AMD (+33.4%) grew without gaining a single place. Intel was the only top-10 company whose revenue declined (-3.7%).
Q4. What does market concentration mean for companies outside the AI industry? As the largest suppliers prioritize capacity for HBM and AI server products, supply of non-AI components for industrial and automotive use can tighten and prices can rise. Buyers' component availability increasingly depends on suppliers' investment priorities, which raises the importance of long-term agreements and dual sourcing.
Sources
- Industry research firm (Omdia) data presented at Evertiq Expo Warsaw, reported October 22, 2026: https://evertiq.com/news/2026-10-22-evertiq-expo-warsaw-top-10-chip-companies-took-two-thirds-of-a-record-market
This article is for information purposes only and is not a recommendation to buy or sell any security. Figures follow the cited research firm's methodology and may differ from other published estimates.
📩 Missed today's analysis? Get tomorrow's in your inbox
Daily Silicon at 10:30 KST plus earnings and analyst-report breakdowns, first. Samsung Electronics, SK hynix, TSMC and HBM supply, read by practicing engineers. Join 300+ subscribers.
Subscribe free →
Free · No spam · Unsubscribe anytime