VLSI Korea
Samsung Overtakes SK hynix in HBM Revenue: 5 Facts Behind the Q3 Reversal (HBM4)
Bernstein estimates put Q3 2026 HBM revenue at USD 8.7B for Samsung Electronics vs USD 7.6B for SK hynix. The share gap narrowed from 37 to 17 points, HBM4 drove the reversal, and revenue leadership is not profit leadership.


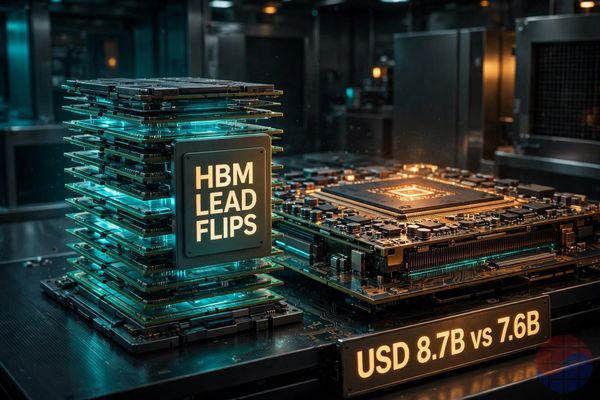
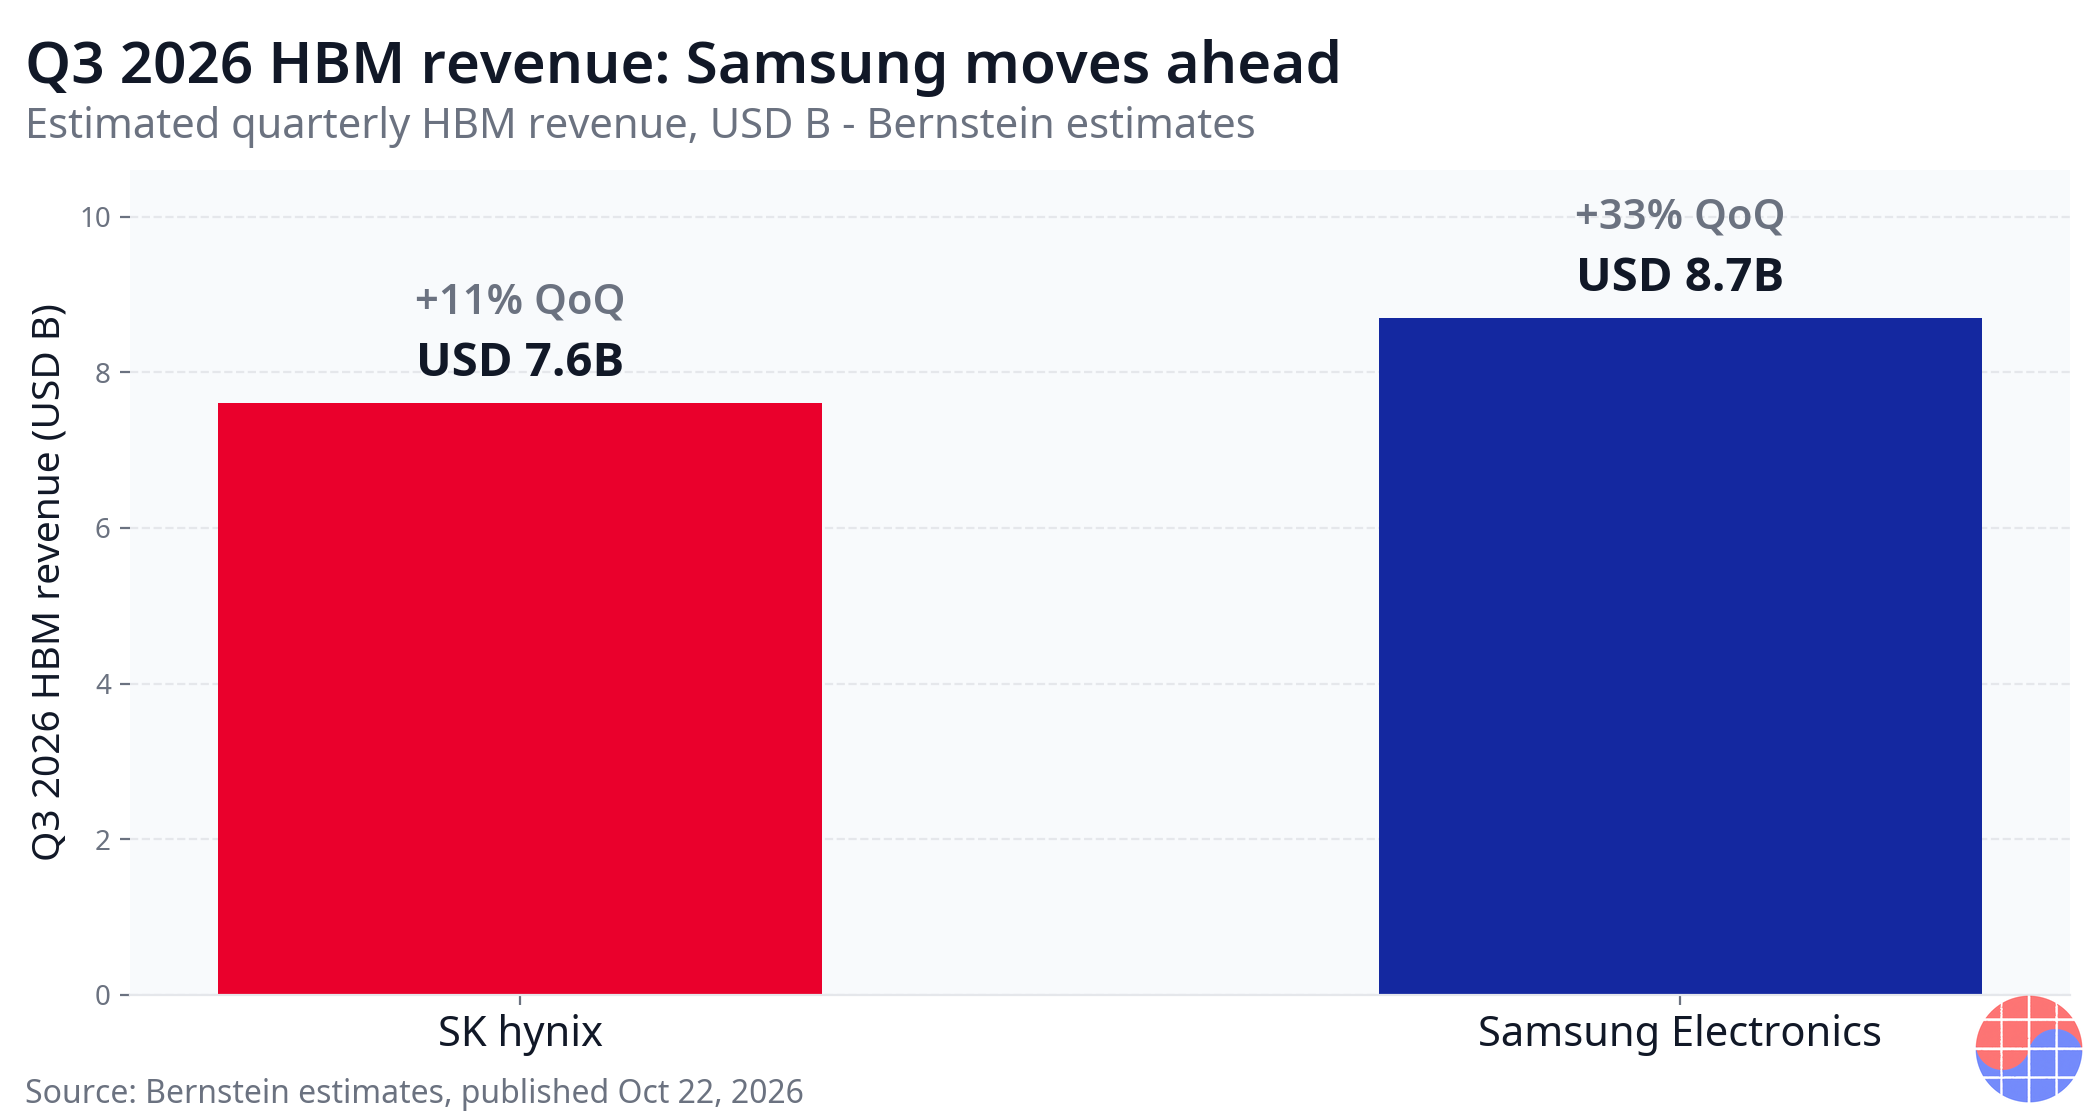
On Bernstein estimates published October 22, 2026, Samsung Electronics posted Q3 2026 HBM revenue of USD 8.7B against USD 7.6B for SK hynix — the first quarterly HBM revenue lead change of this AI cycle. It is a revenue reversal, not yet a profit reversal.
30-Second Summary
- Bernstein estimates published on October 22, 2026 put Q3 2026 HBM revenue at USD 8.7B for Samsung Electronics (+33% QoQ) and USD 7.6B for SK hynix (+11% QoQ). Both figures are external estimates, not results reported by either company.
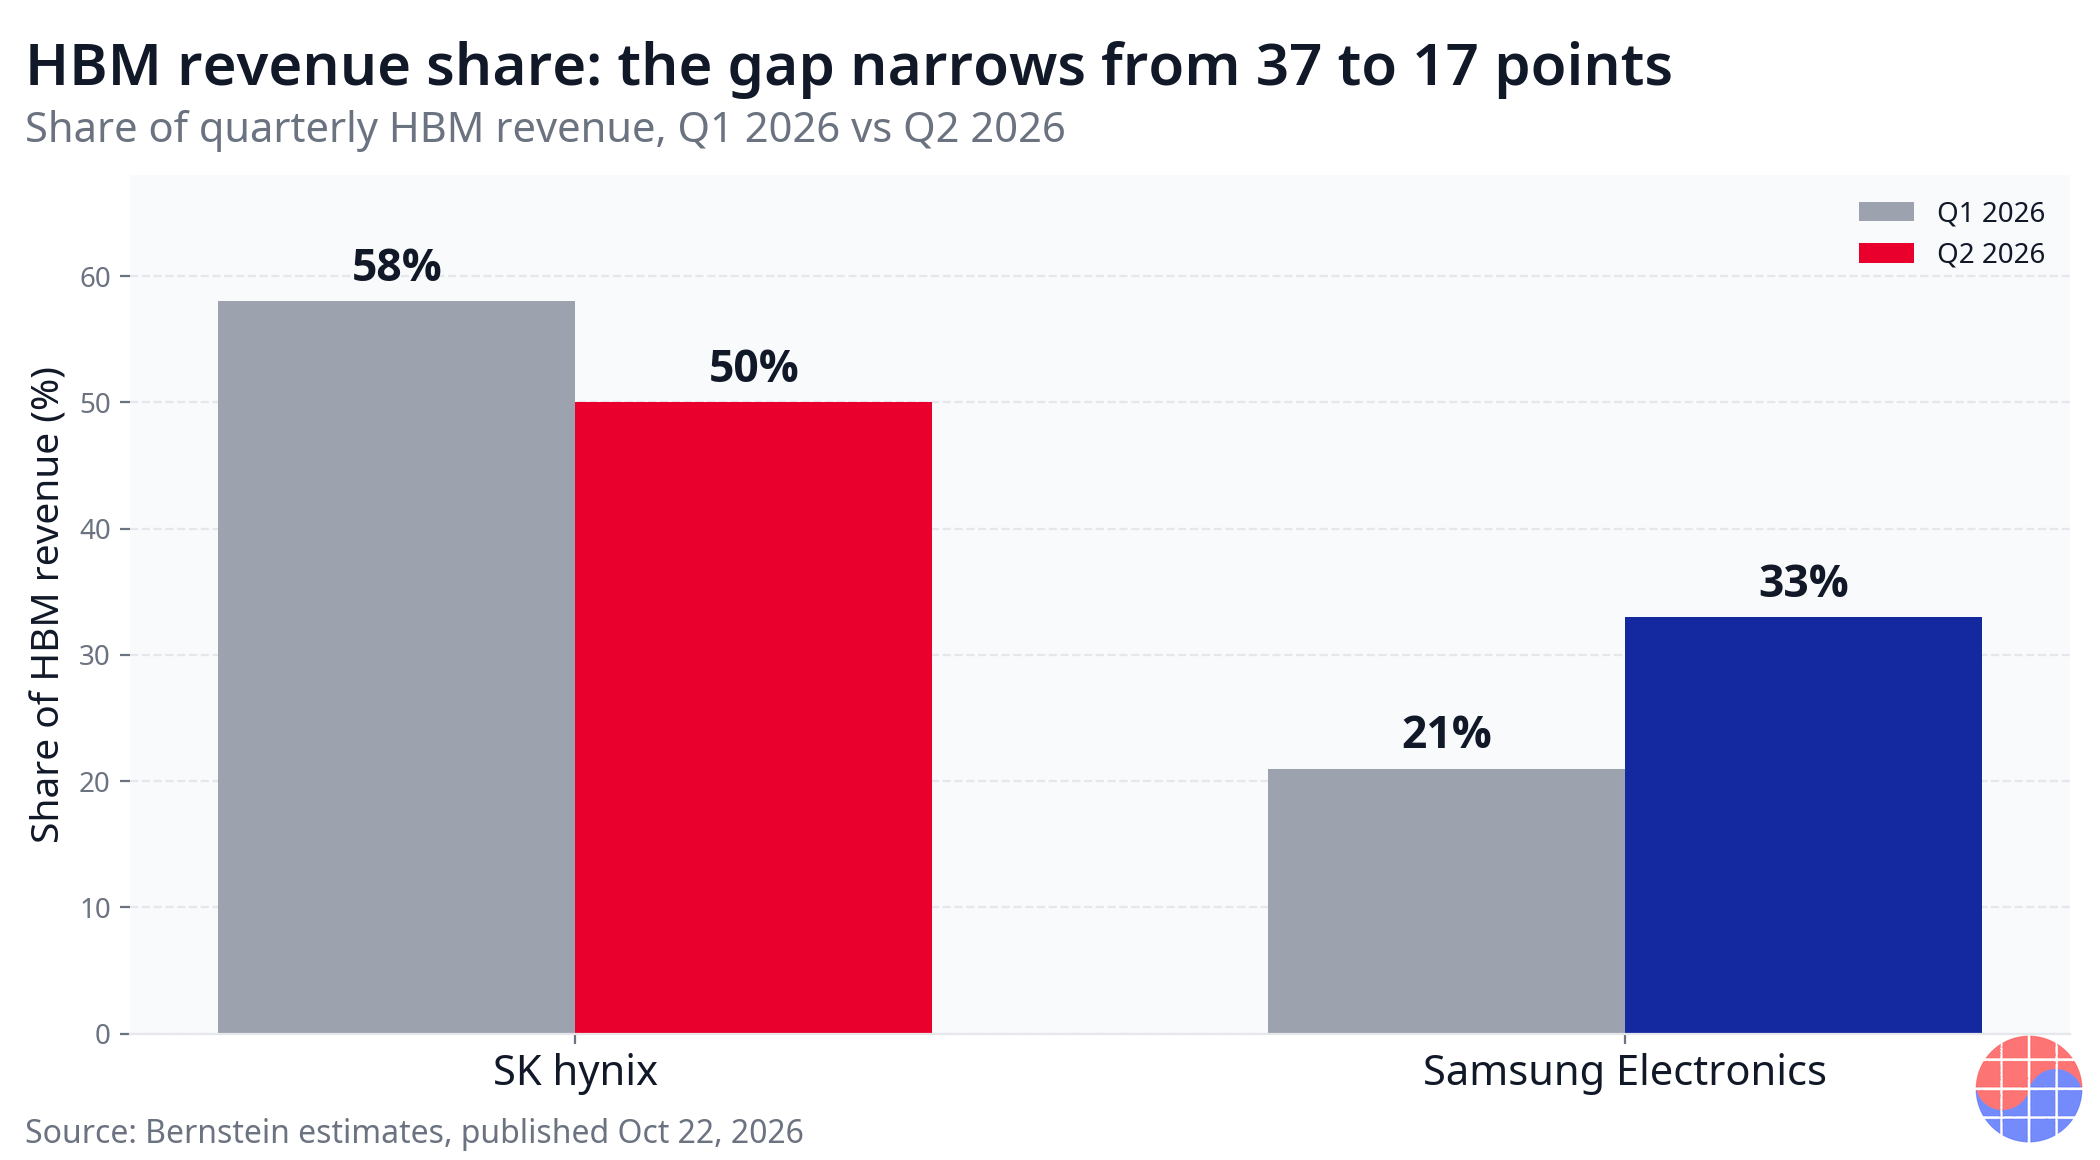
- The share shift was already under way in Q2. SK hynix's share of HBM revenue fell from 58% in Q1 2026 to 50% in Q2 2026, while Samsung Electronics rose from 21% to 33%, narrowing the gap from 37 percentage points to 17 percentage points.
- HBM4 powered the reversal. On its Q2 earnings call, Samsung Electronics said Q3 HBM4 revenue would more than triple QoQ and that HBM4 would account for more than 60% of its HBM revenue in H2 2026.
- Forward views diverge in method but agree in direction. JPMorgan projects SK hynix's HBM share easing from 60% in 2025 to 46% in 2026 and 41% in 2027, while UBS expects Samsung Electronics to lead 2027 bit shipments 41% to 39%.
- The next check is earnings: SK hynix reports Q3 results on October 28, 2026, and Samsung Electronics on October 29, 2026.
Background
HBM, the high-bandwidth memory stacked beside AI accelerators, has had a de facto standard supplier throughout this AI cycle: SK hynix. It qualified first with the leading AI accelerator customer, started volume supply first at each new generation, and held a majority share of HBM revenue for years as a result. Samsung Electronics was, by contrast, the cycle's most frustrated challenger. Its HBM3E qualification ran late, its share sat in the low 20s, and the market priced HBM for a long time on a simple premise: this was SK hynix's market.
The generational shift to HBM4 changed the terms of competition. HBM4 doubles the interface width to 2048-bit and moves logic into the base die, so the product is no longer decided by memory manufacturing skill alone. Customer qualification standards, turnkey supply capability, and sheer capacity are back at the center of the contest. Samsung Electronics is the only supplier that houses memory, foundry, and advanced packaging under one roof. The company that fell behind on HBM3E was suddenly positioned to redraw the map on HBM4.
The Q3 numbers are the first time that structural shift has shown up in revenue. They are still estimates, and the figures may move when both companies report. But because share had already been migrating steadily across Q1 and Q2, the reversal is better read as the cumulative result of several quarters of movement than as a one-quarter accident.
5 Facts
Fact 1. The ranking flipped in Q3 estimated revenue
Bernstein estimates published on October 22, 2026 put Samsung Electronics' Q3 2026 HBM revenue at USD 8.7B, up 33% QoQ, against USD 7.6B for SK hynix, up 11% QoQ. Both companies grew; they grew at different speeds, and the difference in speed changed the ranking. It is the first time in this AI cycle that Samsung Electronics has led SK hynix in quarterly HBM revenue. To be clear once more: these are Bernstein estimates, not figures reported by either company, and any gap to actual results will be visible when earnings land at the end of October.
Fact 2. The share gap halved in six months, from 37 points to 17 points
In Q1 2026, HBM revenue share stood at 58% for SK hynix and 21% for Samsung Electronics — a 37-percentage-point gap. By Q2 2026 it was 50% against 33%, a gap of 17 points. Samsung Electronics took 12 points of share in a single quarter. With the direction and the pace of the shift already established, a Q3 revenue reversal was not surprising in direction. What surprised was how early it arrived.
Fact 3. The direct driver was the HBM4 ramp
On its Q2 earnings call, Samsung Electronics said directly that Q3 HBM4 revenue would more than triple QoQ. It also said HBM4 would make up more than 60% of its HBM revenue in H2 2026. The company's own guidance points in the same direction as the Q3 estimates. Industry reports put Samsung Electronics' HBM4 yield at around 80%, but that figure is an industry estimate, not a number the company has confirmed. Even so, an estimated tripling of HBM4 revenue suggests qualification and the production ramp advanced at the same time.
Fact 4. 2027 projections split by method, but converge on a narrowing gap
JPMorgan projects SK hynix's HBM share declining in steps: 60% in 2025, 46% in 2026, and 41% in 2027. UBS, looking at 2027 bit shipments, expects Samsung Electronics at 41% and SK hynix at 39% — a Samsung Electronics lead. The two forecasts measure different things: JPMorgan tracks revenue share, UBS tracks bit shipments. They cannot be placed side by side as if they were the same metric, but it is significant that at least two major institutions are pointing the same way: SK hynix's overwhelming lead is fading.
Fact 5. SK hynix's counterweights are still formidable
A revenue reversal is not a loss of leadership. Per reporting, SK hynix remains the only supplier shipping the denser 16-layer HBM stacks for Rubin in volume. The tallest stack is the hardest product to build, and sole supply there converts into premium ASP and customer leverage. The profit picture points the same way. DS Investment estimates SK hynix's Q3 2026 operating profit at KRW 70.1 trillion, and IBK Investment & Securities estimates KRW 75.1 trillion. Losing the revenue lead does not flip the profit ranking in the same quarter.
Business Deep Dive
How the share moved
| Metric | Q1 2026 | Q2 2026 | Change |
|---|---|---|---|
| SK hynix share of HBM revenue | 58% | 50% | -8 pp |
| Samsung Electronics share of HBM revenue | 21% | 33% | +12 pp |
| Gap between the two | 37 pp | 17 pp | -20 pp |
| All other suppliers combined | 21% | 17% | -4 pp |
The table shows this is more than a two-horse argument. Of the 12 points Samsung Electronics gained, 8 points came from SK hynix and the rest from other suppliers. In other words, Q2's shift took the form of the two leaders absorbing share from everyone else while closing the distance between themselves. The HBM market was hardening into a Korean duopoly at the same moment the balance of power inside that duopoly started to move.
📩 Following this story?
Get the follow-up analysis — earnings, reports and HBM supply — in your inbox daily at 10:30 KST. Subscribe free →
Comparing the projections
| Source | Metric | 2025 | 2026 | 2027 |
|---|---|---|---|---|
| JPMorgan projection | SK hynix HBM share | 60% | 46% | 41% |
| UBS projection | 2027 bit shipment share | — | — | Samsung Electronics 41% / SK hynix 39% |
| Bernstein estimate (Oct 22, 2026) | Q3 HBM revenue | — | Samsung Electronics USD 8.7B / SK hynix USD 7.6B | — |
On JPMorgan's trajectory, SK hynix cedes 19 points of share in two years yet still holds the revenue-share lead through 2027. On UBS's bit-shipment basis, Samsung Electronics moves ahead in 2027. The two forecasts do not contradict each other; they answer different questions. "Who sells more value?" and "Who ships more bits?" are different questions, and the fact that their answers diverge is itself evidence that competition in the HBM4 generation is multi-layered.
A revenue reversal is not a profit reversal
This is the point most often missed. Revenue is volume multiplied by price; profit adds product mix and cost structure on top. SK hynix holds sole-supplier status on the highest-specification product, the 16-layer stack, and that supports premium ASP. Samsung Electronics' Q3 revenue jump, by contrast, carries a large early-ramp volume effect, and early ramps usually weigh on margins through yield stabilization costs and upfront investment. The DS Investment estimate of KRW 70.1 trillion and the IBK estimate of KRW 75.1 trillion for SK hynix's Q3 operating profit say the same thing: in the quarter the revenue ranking changes, the center of profit gravity still sits with SK hynix.
Business structure matters too. Samsung Electronics' strength is turnkey supply: memory, a logic foundry for the base die, and advanced packaging in one package, which simplifies the customer's supply chain. From HBM4 onward, with the base die built on a logic process, that strength grows with each generation. SK hynix's strength is its execution record. Qualifying first and shipping first at generation after generation leaves a mark in customers' risk assessments, and large customers do not lightly replace a proven supplier in long-term agreements. That is why contract structure slows the pace at which share shifts show up in results.
The most tangible consequence of share loss for SK hynix is pricing power. A sole dominant supplier above 50% share effectively sets the reference point in price negotiations. Once share slides into the 40s, the arithmetic changes: customers can use the second source as a negotiating lever, and volume allocation in long-term agreements starts to resemble competitive bidding. For Samsung Electronics, rising share converts directly into a stronger voice in next-generation qualification. From HBM4E onward, customers are increasingly likely to structure volumes around multiple qualified suppliers from the start.
Chase's Take
The essence of this reversal is not a technology upset. It is a change in what qualification compounds. Through the HBM3E generation, the game was almost entirely "who passes qualification first," and SK hynix won that game every time. HBM4 widened the rules. With a wider interface and logic in the base die, the contest expanded from memory yield alone to a bundle of memory, logic, and packaging. A bigger game favors the player holding turnkey assets. Samsung Electronics' Q3 is the first quarter in which that structural change was translated into numbers.
From a Korean perspective, framing this as a fight between two domestic champions misses half the picture. Combined, the two companies' share of HBM revenue actually rose, from 79% in Q1 2026 to 83% in Q2 2026. The center of the world's AI memory supply sits in Korea, and that fact has not changed — it has strengthened. What is changing is the internal split. For investors and industrial policy alike, the split now matters more than the total, because the two companies' CapEx scale, margin profiles, and customer portfolios have begun moving in different directions.
One cold caveat deserves emphasis. The evidence for this reversal is still an estimate. Whether the Bernstein figures are confirmed or revised will be settled on October 28 and 29, 2026. Treating an estimate-stage reversal as settled fact is a mistake. But the direction of share movement matches the measured flow across Q1 and Q2, so even if the Q3 revenue ranking prints differently from the estimate, the larger picture — a narrowing gap — is unlikely to be overturned.
Implications
- Separate the revenue crown from the profit crown. Q3 2026 is likely a quarter in which the revenue ranking changes while the profit ranking holds. Conflating the two into a simple "changing of the guard" misses how competition in the HBM4 generation actually works.
- Track the migration of pricing power. If SK hynix's slide into the 40% range is confirmed, the reference point in HBM price negotiations shifts from a sole-supplier structure to a multi-supplier one. Volume allocation terms in long-term agreements are the first place that signal appears.
- Turnkey capability becomes the entry ticket for the next generation. From HBM4E onward, the logic content of the base die grows further. Responding to generational change on memory capability alone gets harder, which raises the entry barrier for latecomer suppliers.
- The next checkpoint is October 28-29, 2026. SK hynix and Samsung Electronics Q3 earnings — their HBM revenue commentary, HBM4 mix, and Q4 guidance — will determine whether the estimate-stage reversal hardens into fact.
FAQ
Q1. Has Samsung Electronics actually overtaken SK hynix? On Bernstein estimates published October 22, 2026, yes: Q3 2026 HBM revenue is estimated at USD 8.7B for Samsung Electronics and USD 7.6B for SK hynix. These are estimates, not reported results. Confirmation comes with SK hynix earnings on October 28, 2026 and Samsung Electronics earnings on October 29, 2026.
Q2. What caused the reversal? The HBM4 ramp. On its Q2 earnings call, Samsung Electronics said Q3 HBM4 revenue would more than triple QoQ and HBM4 would exceed 60% of H2 2026 HBM revenue. Its revenue share had already climbed from 21% in Q1 2026 to 33% in Q2 2026.
Q3. Does the revenue reversal mean a profit reversal? No. DS Investment estimates SK hynix Q3 2026 operating profit at KRW 70.1 trillion and IBK Investment & Securities at KRW 75.1 trillion. SK hynix also remains, per reporting, the only supplier shipping 16-layer stacks for Rubin in volume, so the revenue and profit rankings can move differently for some time.
Q4. What should we watch next? Q3 earnings on October 28, 2026 (SK hynix) and October 29, 2026 (Samsung Electronics). The first check is whether both companies' HBM commentary matches the Bernstein estimates. Over the medium term, watch whether JPMorgan's SK hynix share trajectory (60% in 2025, 46% in 2026, 41% in 2027) and UBS's 2027 bit shipment view (Samsung Electronics 41%, SK hynix 39%) show up in actual contracts and volume allocation.
Sources
- Bernstein HBM revenue estimates, published October 22, 2026
- JPMorgan HBM share projections, 2025-2027
- UBS 2027 HBM bit shipment projection
- Samsung Electronics Q2 2026 earnings call comments
- DS Investment and IBK Investment & Securities estimates for SK hynix Q3 2026 operating profit
This article is for information only and is not a recommendation to buy or sell any security. Q3 HBM revenue figures are Bernstein estimates and may differ from results officially reported by each company.
📩 Missed today's analysis? Get tomorrow's in your inbox
Daily Silicon at 10:30 KST plus earnings and analyst-report breakdowns, first. Samsung Electronics, SK hynix, TSMC and HBM supply, read by practicing engineers. Join 300+ subscribers.
Subscribe free →
Free · No spam · Unsubscribe anytime