VLSI Korea
Profits Doubled, Prices Fell: This Week's Earnings Settle the Chip Debate
The SOX fell 11.41% in a week after eight straight down days, yet SMH constituents' earnings roughly doubled in a year and the trailing P/E fell from 38x to 32x. TSMC and ASML already answered with record prints. Four reports — Lam on Oct 21 to Intel on Oct 29 — now settle the debate.


30-Second Summary
- The Philadelphia Semiconductor Index (SOX) closed at 11,137.29 on October 16, 2026, down 11.41% on the week after eight straight losing sessions — its longest losing streak since 2008. The index sits 23.9% below its high, yet still up 57.2% year to date. (Source)
- The week's biggest losers were equipment and memory names: Lam Research fell 17.22% to $263.94, Western Digital 16.43%, Micron 14.59% and Intel 14.18%.
- The counter-numbers point the other way. Over the past year the SMH semiconductor ETF rose about 70% while its constituents' earnings roughly doubled — and its trailing P/E actually fell from 38x to 32x. Prices went up; profits went up faster. (Source)
- TSMC's third quarter already voted: revenue of $46.72B, net income up 68.7% year on year, and fourth-quarter guidance of $52.3B–$54.3B. ASML posted record third-quarter sales of €11.662B. (Source) (Source)
- The verdict arrives this week and next. Lam Research and Texas Instruments report on October 21, Western Digital on October 22, SK hynix on October 28 and Intel on October 29.
- The core call: this selloff was priced on fear of an earnings peak. Only earnings can settle it — and the first witness is the equipment maker, not the memory maker.
Background: Eight Down Days, Two Stories
On Friday, October 16, 2026, the SOX closed at 11,137.29. It was the eighth consecutive daily decline — the longest losing streak for the index since 2008. The weekly loss was 11.41%. From its high, the index is down 23.9%, a bear-market print by the textbook definition. The SOXX ETF fell 4.14% on the day to $493.39. And yet the same index is still up 57.2% year to date. Both facts are true at once, which is exactly why the argument is so loud.
The damage concentrated where the AI trade had run hardest. Lam Research, the etch and deposition equipment maker, lost 17.22% in the week to close at $263.94. Western Digital fell 16.43%. Micron fell 14.59%. Intel fell 14.18%. The selling thesis, repeated everywhere, was simple: AI capex is financed with borrowed money, the returns are unproven, and chip profits have peaked.
The counter-thesis is also simple, and it is built on arithmetic rather than mood. Over the twelve months to mid-October, SMH gained about 70% and SOXX about 87% — but the earnings of SMH's constituents roughly doubled over the same period. Because earnings grew faster than prices, the trailing P/E of SMH compressed from 38x to 32x even as the index climbed. For comparison, S&P 500 earnings grew by roughly a third over a similar window. A sector whose earnings double while its multiple falls is an unusual bubble candidate. That does not make it cheap in any absolute sense — 32x is still a full price — but it changes what has to be true for the bears to win: earnings growth must not just slow, it must break.
Two results already on the board support the profit side. TSMC, the foundry that manufactures the AI accelerators at the center of the trade, reported third-quarter revenue of $46.72B — up 50.9% year on year in NT-dollar terms — with net income up 68.7%. Advanced nodes at 7nm and below were 79% of wafer revenue, and HPC was 68% of the total. Its fourth-quarter guidance of $52.3B to $54.3B implies growth of roughly 58%. ASML, the sole supplier of EUV lithography, reported record third-quarter sales of €11.662B and net income of €4.960B at a 57.5% gross margin, and said customer demand exceeds its supply capacity through 2028, with customers signaling orders for 2029 and 2030.
So the market is not arguing about the past. The past is printed. The argument is about whether the earnings line bends from here — and that is a question only the next four reports can answer.
Business Deep Dive
1. The Selloff in Numbers
| Name | Weekly change (to Oct 16, 2026) | Close / note |
|---|---|---|
| Lam Research | −17.22% | $263.94 |
| Western Digital | −16.43% | Earnings Oct 22 |
| Micron | −14.59% | Memory bellwether |
| Intel | −14.18% | Earnings Oct 29 |
| SOX Index | −11.41% | 11,137.29; 8 straight down days |
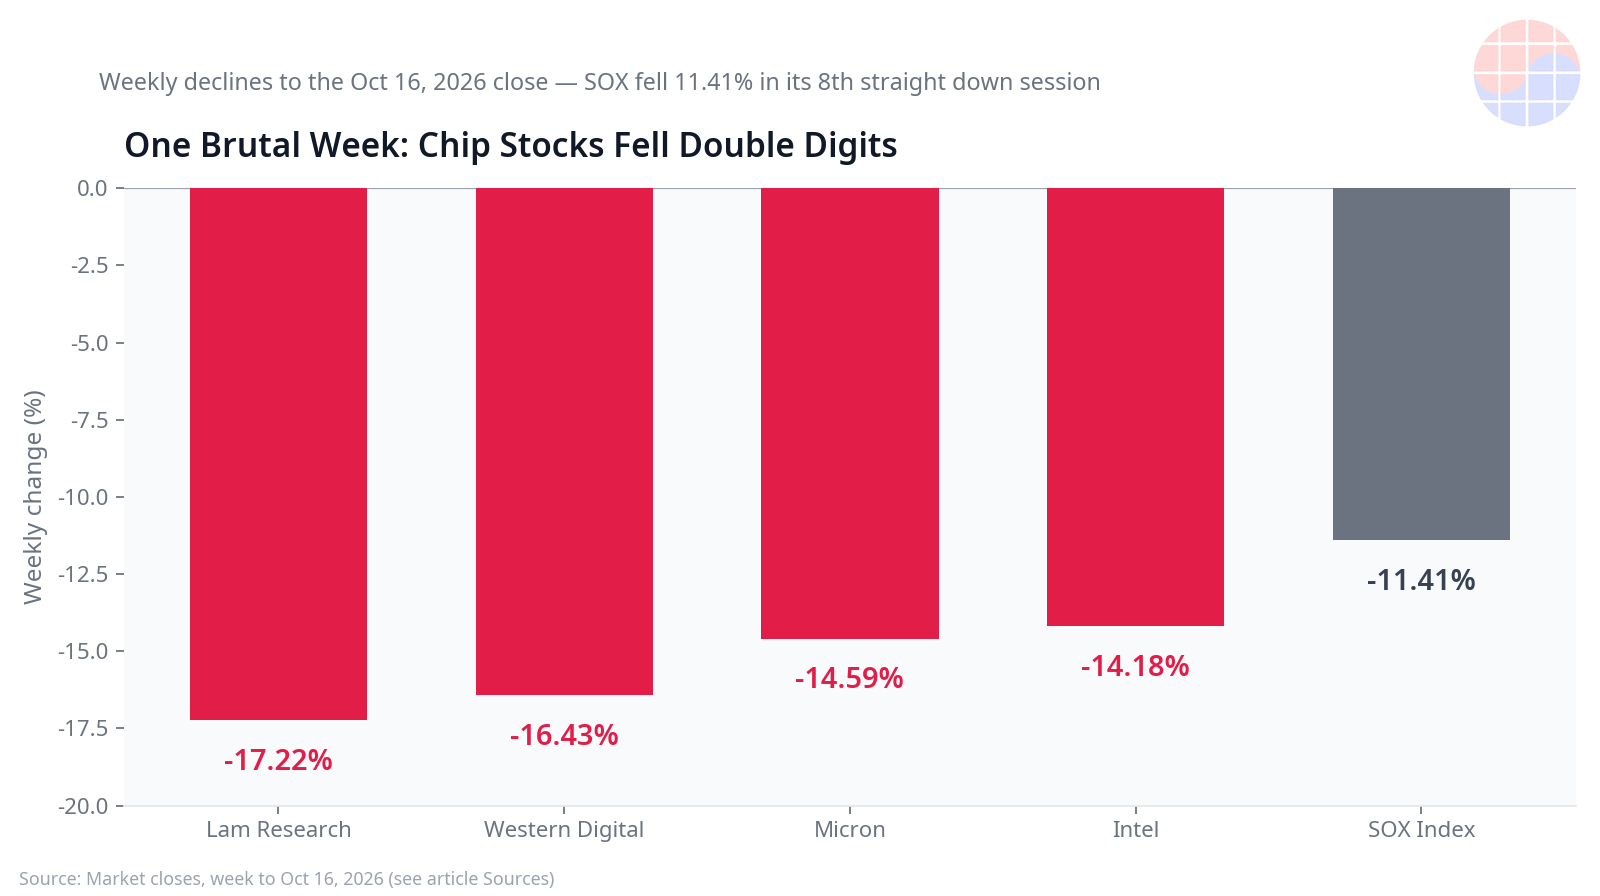
Source: Market closes to October 16, 2026. (Source)
Three features of the decline matter more than its size. First, it was broad but not uniform: the index fell 11.41% while individual AI-supply-chain names fell 14–17%, the classic signature of position unwinding in the most crowded trades rather than company-specific news. Second, it happened into earnings season, not after a guidance cut — no major chipmaker had actually warned. Third, at −23.9% from the high, the drawdown has already priced a material earnings disappointment. If earnings merely meet the bar, the bar itself becomes the catalyst.
2. The Profit Side of the Ledger
| Metric | Value | Period |
|---|---|---|
| SMH price change | ~+70% | Past year (to ~Oct 14) |
| SMH constituents' earnings | ~2x | Past year |
| SMH trailing P/E | 38x → 32x | Past year |
| SOXX price change | ~+87% | Past year |
| S&P 500 earnings growth | ~+1/3 | Comparable window |
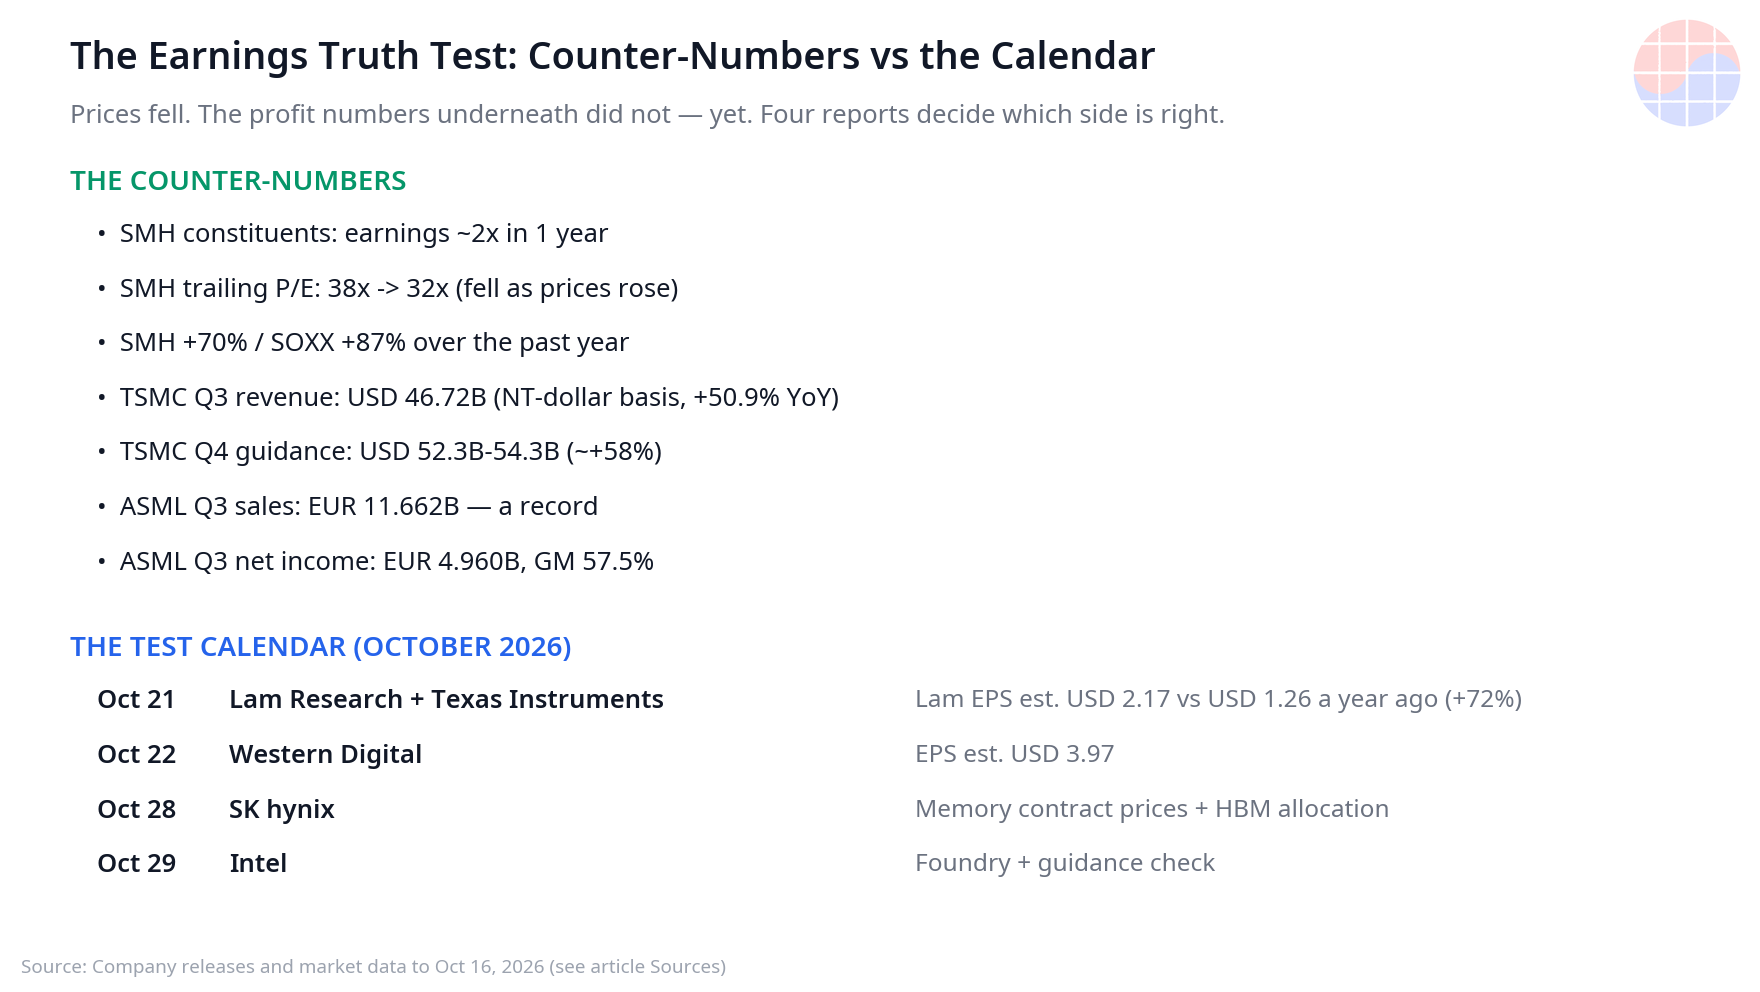
Source: ETF and index data to mid-October 2026. (Source)
This is the table the bubble argument has to explain away. In a classic mania, prices outrun earnings and the multiple expands until it snaps. Here the sequence ran in reverse: earnings outran prices, and the multiple contracted while the index rose 70%. The October selloff then cut prices further against an earnings base that, as of the last reported quarters, was still accelerating — TSMC's net income grew 68.7% year on year in Q3, and its Q4 guide points to roughly 58% revenue growth.
The honest caveat is that trailing numbers are, by construction, backward-looking. A trailing P/E of 32x is comforting only if the "E" survives. Which is why the debate now moves, correctly, from valuation ratios to forward evidence: orders, WFE outlooks, memory contract prices and capex language. Those arrive in the next eight days.
3. Why Equipment Answers First: The Lam Test
Lam Research reports on Wednesday, October 21 — and it is the most informative print of the week, for a structural reason. Memory and logic makers sell what they have already built. Equipment makers sell what their customers plan to build next. Lam's order book and WFE commentary are therefore a leading indicator of the entire chain's 2027 intentions, including the capex of TSMC, Samsung, SK hynix and Micron.
The bar is high and specific. Consensus expects EPS of $2.17, up from $1.26 a year ago — a 72% jump. Lam's own guidance frames revenue at $8.1B ± $0.4B. The recent run-rate supports ambition: last quarter Lam posted revenue of $6.722B, up roughly 30% year on year, with NAND-related revenue doubling quarter on quarter, advanced packaging expected to grow more than 70% in 2026, and China at 34% of FY2026 revenue.
| Lam Research checkpoint | Number |
|---|---|
| Q3 EPS consensus | $2.17 |
| Year-ago EPS | $1.26 (+72% expected) |
| Company revenue guidance | $8.1B ± $0.4B |
| Prior-quarter revenue | $6.722B (~+30% YoY) |
| China share of FY2026 revenue | 34% |
What to listen for, in order: (1) the WFE outlook for 2027 — raised, held or cut; (2) NAND and advanced-packaging commentary, the two fastest-growing lines; (3) China revenue color, where export-control risk concentrates; (4) any language about customers pushing out — or pulling in — tool deliveries. A clean beat with a firm WFE outlook does not just rescue Lam's stock; it underwrites the capex plans of every customer that sold off alongside it.
4. The Test Calendar
| Date (Oct 2026) | Company | What it tests | Key number |
|---|---|---|---|
| Oct 21 | Lam Research | WFE demand, 2027 capex intentions | EPS est. $2.17 vs $1.26 |
| Oct 21 | Texas Instruments | Broad industrial/analog demand | Cycle breadth |
| Oct 22 | Western Digital | Storage demand, pricing | EPS est. $3.97 |
| Oct 28 | SK hynix | Memory contract prices, HBM | Pricing direction |
| Oct 29 | Intel | Foundry progress, guidance | Execution credibility |
Texas Instruments, reporting the same evening as Lam, tests breadth: if the downturn were a general semiconductor cycle turn, the analog bellwether would feel it first across industrial and automotive orders. Western Digital on October 22 tests the storage leg — its expected EPS of $3.97 prices in strong pricing power, and its commentary on datacenter demand will either corroborate or contradict the AI-infrastructure story. SK hynix on October 28 is the memory verdict: contract-price direction and HBM allocation language matter more than the quarter itself. Intel on October 29 closes the sequence with the idiosyncratic case — part earnings test, part foundry credibility test.
Sequencing is the point. By the time SK hynix speaks on the 28th, the equipment and storage witnesses will already have testified. If Lam's WFE outlook and Western Digital's pricing hold up, the burden of proof shifts to the bears before the memory names even report.
5. Separating the Financing Fear from the Demand Fact
Much of the October anxiety is not really about chips. It is about how the AI buildout is financed — debt-funded datacenters, circular vendor financing, and the fear that capex is a confidence game. That fear may even be justified at the level of individual projects. But it is a different claim from "chip earnings have peaked," and the two should not be traded as one position.
The demand facts, as of the last prints, are stubborn: the only EUV supplier says demand exceeds supply through 2028; the dominant foundry guided the December quarter to roughly +58% revenue growth; the equipment leader is expected to grow EPS 72% year on year. Financing structures determine who bears losses if demand disappoints. They do not change the shipment data if it does not. The next four reports are where those two stories finally get separated — order books and contract prices on one side, balance-sheet commentary on the other.
Chase's Take
The bubble debate keeps failing because both sides argue from price. One side points at a chart that rose 70% in a year and says "mania." The other points at the same chart down 23.9% from its high and says "opportunity." Price is the noisiest variable in the room. The quiet variable — earnings — doubled in a year while the multiple fell from 38x to 32x. Whatever this is, it is not the standard anatomy of a bubble, where the multiple does the running and earnings trail behind apologizing.
But the conditional matters, and it cuts both ways. The entire "profits doubled" defense rests on the earnings slope staying steep. A sector at 32x trailing earnings with earnings still compounding at TSMC-speed — net income +68.7%, next quarter guided to +58% revenue growth — is defensible. The same 32x with a bending earnings slope is a trap, because the multiple will not compress politely; it will gap. That asymmetry is exactly why this week matters more than the last eight sessions combined. The selloff was the market pre-paying for an earnings disappointment that has not yet been announced by anyone. Either the disappointment shows up in orders and guidance — starting with Lam's WFE outlook on the 21st — or the pre-payment gets refunded.
My read of the sequence: equipment before memory is the right order, and it favors the profit side. Lam does not sell last quarter's wafers; it sells next year's fabs. If the customers of the AI buildout were quietly throttling capex, Lam's order commentary is where it would surface first. Watch also what nobody watches: ASML's line that demand exceeds supply through 2028, with order intent for 2029–2030. Backlogs that long are not how cyclical peaks usually look. Peaks look like double-ordering and sudden cancellations — and the cancellation watch starts, again, with the equipment calls.
For Korean readers, the hinge date is October 28. SK hynix will not just report a quarter; it will print the memory contract-price direction that the whole HBM complex — Samsung included — trades on. If Lam on the 21st holds the equipment line and SK hynix on the 28th holds the pricing line, the October drawdown will read in hindsight as a financing scare that wandered into the wrong sector. If either breaks, the "profits doubled" table above becomes a trailing indicator in the worst sense. Both outcomes are knowable within eight days. That is a rare luxury — take it, and wait for the prints rather than the posts.
Implications: Investment and Management Takeaways
For investors — the eight-day checklist:
- Oct 21, Lam Research: EPS vs the $2.17 consensus matters less than the 2027 WFE outlook and any push-out/pull-in language on tool deliveries. China revenue color (34% of FY2026) is the risk line.
- Oct 21, Texas Instruments: breadth check. Weak industrial/analog orders would suggest a general cycle turn; stability isolates the selloff to AI-name positioning.
- Oct 22, Western Digital: EPS est. $3.97. Datacenter demand and pricing commentary either corroborate the AI-infrastructure demand story or crack it.
- Oct 28, SK hynix: memory contract-price direction and HBM allocation/backlog language — the Korean market's hinge print.
- Oct 29, Intel: foundry progress and guidance credibility, the idiosyncratic leg of the sequence.
- Positioning logic: at −23.9% from the high with a trailing multiple already compressed to 32x, the burden of proof sits with the earnings bears — but only until the first guidance cut. Size for both branches.
For managers and strategists:
- Read equipment calls as your demand radar. WFE outlooks lead your own order book by two to three quarters; Lam's commentary is a free channel check on every major customer's capex intent.
- Separate financing structure from demand in board discussions. Debt-funded customer capex is a counterparty-risk question for credit terms and contract structure — not evidence that end demand is absent.
- Contract structure over spot noise. Lengthening long-term agreements and allocation mechanisms, visible across the memory complex, are the durable signal; weekly price moves are not.
Sources
- Lam Research fell 17% in a week; four chip companies face the market after an 11% drop
- Is the AI chip bubble bursting? Their profits just doubled
- TSMC Q3 2026 results and Q4 guidance (official release, PDF)
- ASML reports record €11.7 billion in Q3 sales
Note: Figures are as reported to the October 16, 2026 close and the cited releases. Forward-looking expectations (EPS estimates, guidance) are company or consensus figures, not outcomes. This article is analysis, not investment advice.
📩 Subscribe to VLSI Korea
Get our daily semiconductor deep-dives delivered to your inbox first. Free to subscribe.