VLSI Korea
Samsung Electro-Mechanics FC-BGA Expansion: From Customer Funding to Cash
How FC-BGA area, qualified yield and customer funding turn substrate expansion into profit and cash. Samsung Electro-Mechanics, Ibiden and AT&S compared, with a reproducible model.


🆓 Free article · Anyone can read this article for free
Samsung Electro-Mechanics' KRW 6.78 trillion substrate investment is not merely a signal about the scale of AI-server demand. In a production arrangement where customers support capital investment and medium- to long-term volumes, the first questions are who pays cash first and which substrates the customer will accept as good output.
VLSI Korea view: Customer support can reduce the funding burden of a new plant. Profit, however, comes from the area, yield and price of substrates the customer accepts; cash comes from the combination of that profit, investment, working capital and contract settlement.
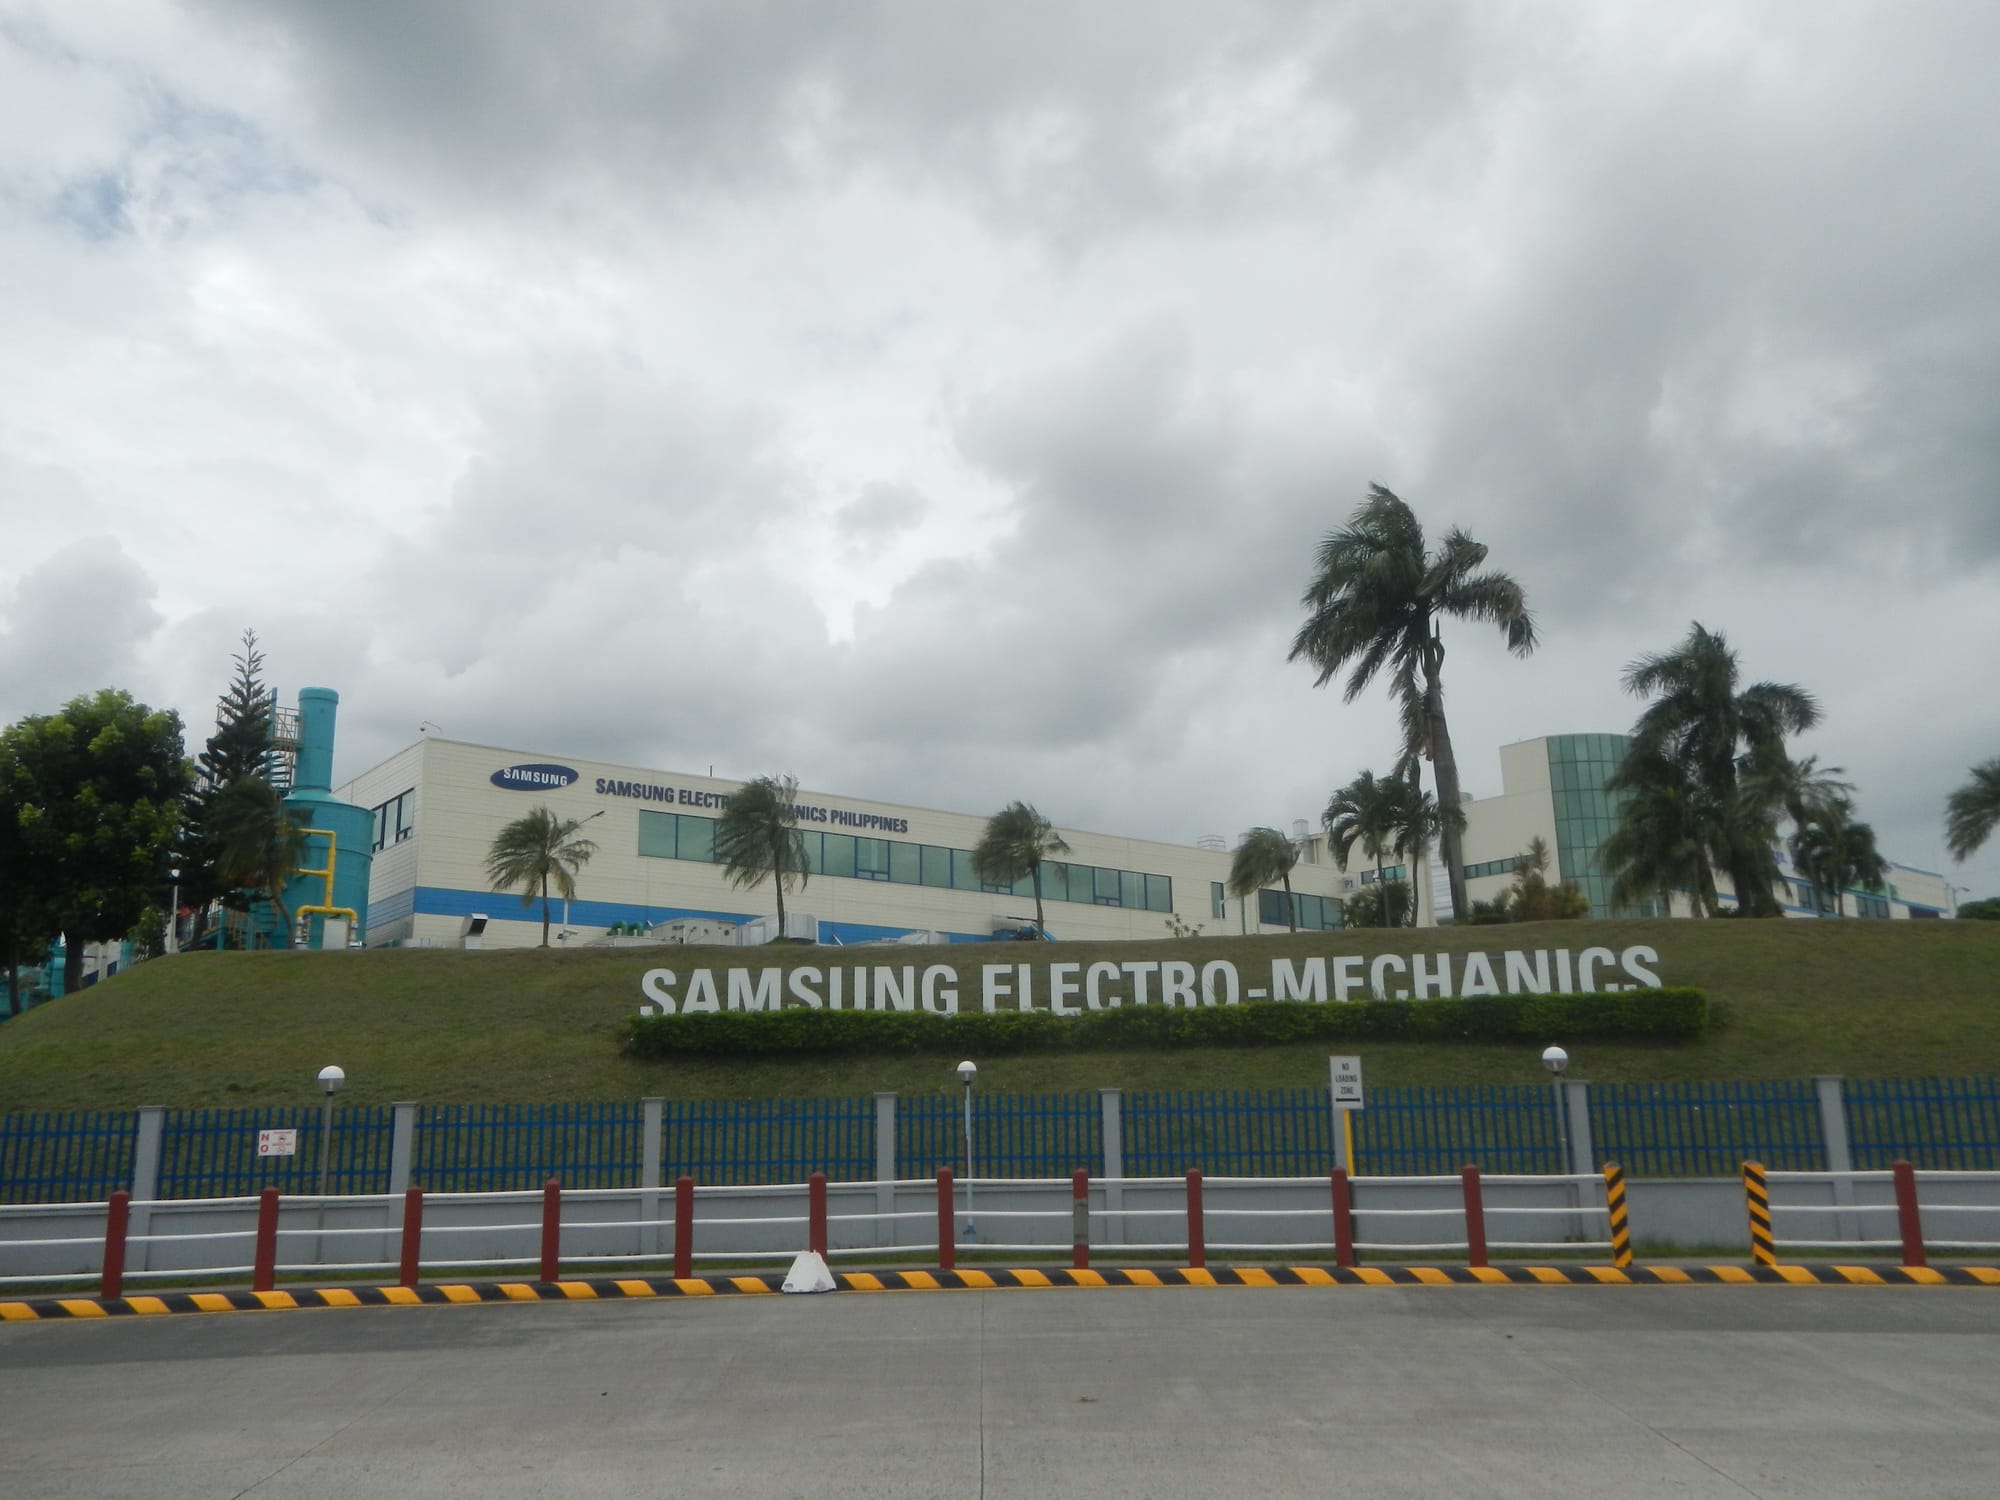
This article uses 2026-10-02 to 2028-10-02 as its decision window. It compares Samsung Electro-Mechanics' Korean and Vietnamese investments with Ibiden's Japanese expansion and AT&S's Malaysian customer-support example, then calculates how a substrate's physical scale can affect revenue and cash. It offers analysts a bridge from investment to profit, and design and procurement teams a way to assess output that can actually be supplied.
The hypothesis is simple: does the interpretation that a larger AI-substrate expansion produces proportionally more supply and profit hold? This is not presented as market consensus. The public record instead places separate variables between an investment announcement and business performance: area, process passes, customer qualification, and funding settlement.
1. KRW 6.78 trillion contains two different clocks
Samsung Electro-Mechanics' 2026-09-28 filings state KRW 4.27 trillion for an expansion of package-substrate production facilities in Sejong and KRW 2.51 trillion for factory-expansion equipment at its Vietnam subsidiary. The KRW 6.78 trillion sum is arithmetically valid, but it does not mean the two amounts are spent on the same date or become mass production on the same date. Sejong investment filing, Vietnam asset-acquisition filing.
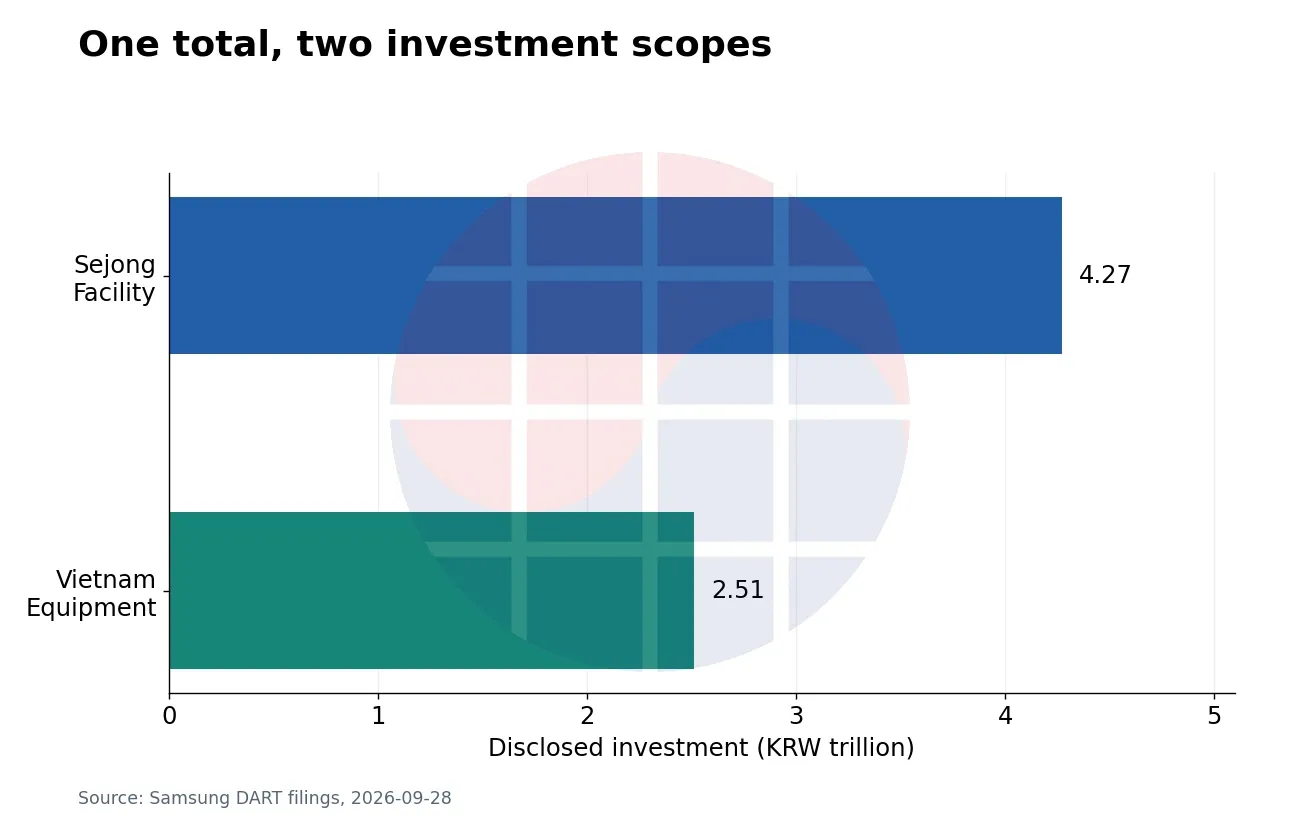
The Sejong filing gives an investment period from 2026-09-28 to 2028-05-31. The company's next-day release separately states a plan to begin mass production in September 2028. Putting the end of the investment period and the start of revenue in the same model column removes the preparation period from the financial model. Samsung Electro-Mechanics investment release.
Vietnam requires more care. The filing's expected asset-acquisition date is 2028-04-30, while the 2026-09-29 release gives a June 2030 target for construction completion and operation. The documents describe different stages, and public information does not resolve their detailed schedule relationship. This article preserves both dates and does not turn the expected acquisition date into a full-factory operating date.
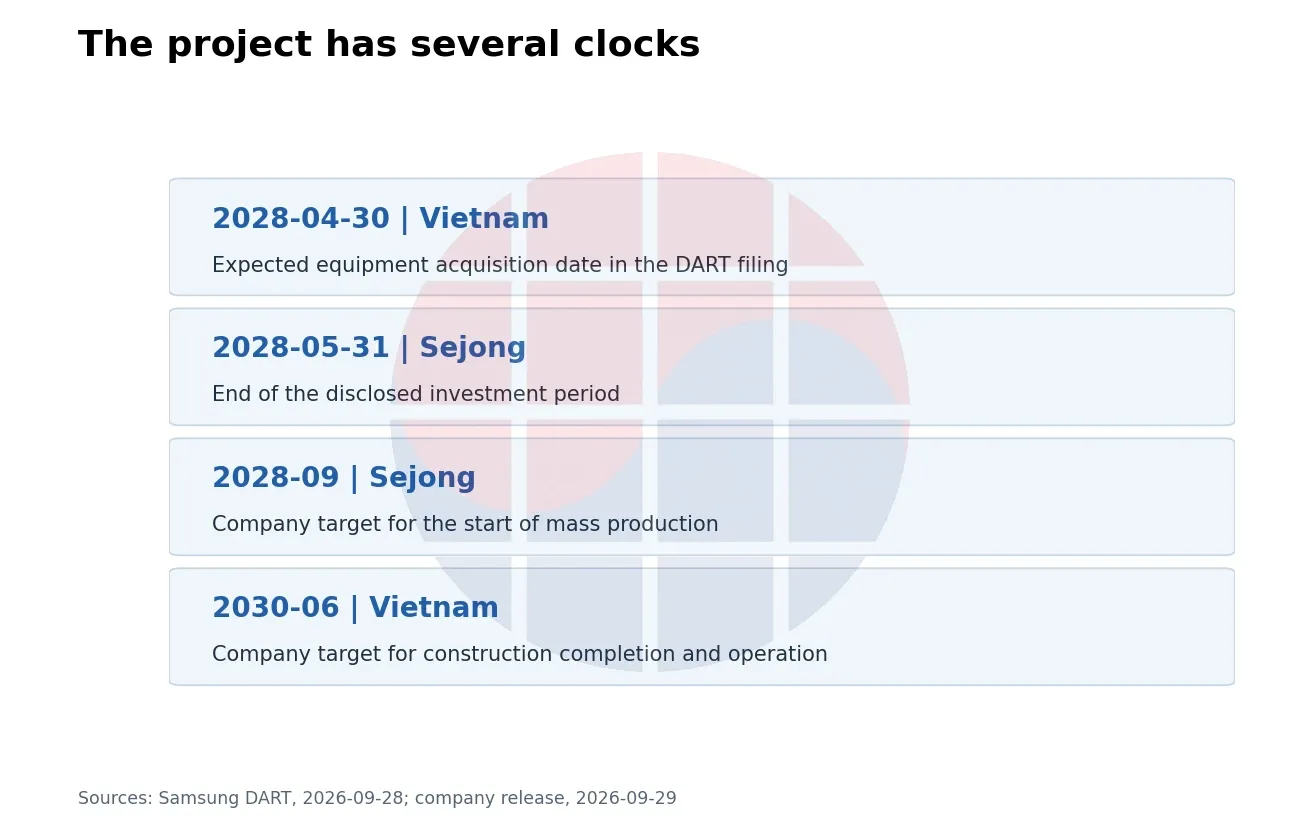
This difference is not a footnote. In a discussion of profit over the next 24 months, Sejong's mass-production target falls at the end of the window while Vietnam's operating target falls outside it. The same aggregate investment can therefore carry a different weight for near-term profit contribution and longer-term supply expansion.
The investment boundary must also remain intact. The Vietnam filing explicitly calls KRW 2.51 trillion equipment investment. Expanding that number into total project cost, including land, buildings and working capital, would distort both future funding needs and return calculations. The appropriate comparison tracks disclosed commitments and actual payments as execution evidence emerges.
Current revenue needs the same narrow treatment. Package Solution revenue was KRW 771.6 billion in the second quarter of 2026. It is neither revenue from AI FC-BGA alone nor operating profit for that division. Applying the company-wide operating margin to it as a shortcut for AI-substrate profit would combine products and cost structures. Samsung Electro-Mechanics Q2 results.
Multiplying quarterly revenue by four gives an annualised KRW 3.0864 trillion; KRW 6.78 trillion is about 2.20 times that level. This is a scale comparison between investment and the present business, not a payback period. The investment spans multiple years, the comparison revenue includes existing plants and other substrates, and cost has not yet been removed from revenue.
A genuine investment-recovery calculation needs incremental cash flow from the new equipment. Volumes moved from existing lines must be separated from new company revenue, and customer support must be mapped through payment and settlement terms. “A multiple of annualised revenue” is useful only for scale; the next step is a plant-level incremental model.
The first task in reading the announcement is consequently to separate the states: approved amount, current-period cash payment, tool arrival, customer qualification, mass-production shipment and cash collection. Evidence of an earlier state should not be used to populate a number for a later state. That discipline reduces the tendency to attach excessive near-term revenue to an expansion headline.
2. What grows before revenue when a substrate gets larger
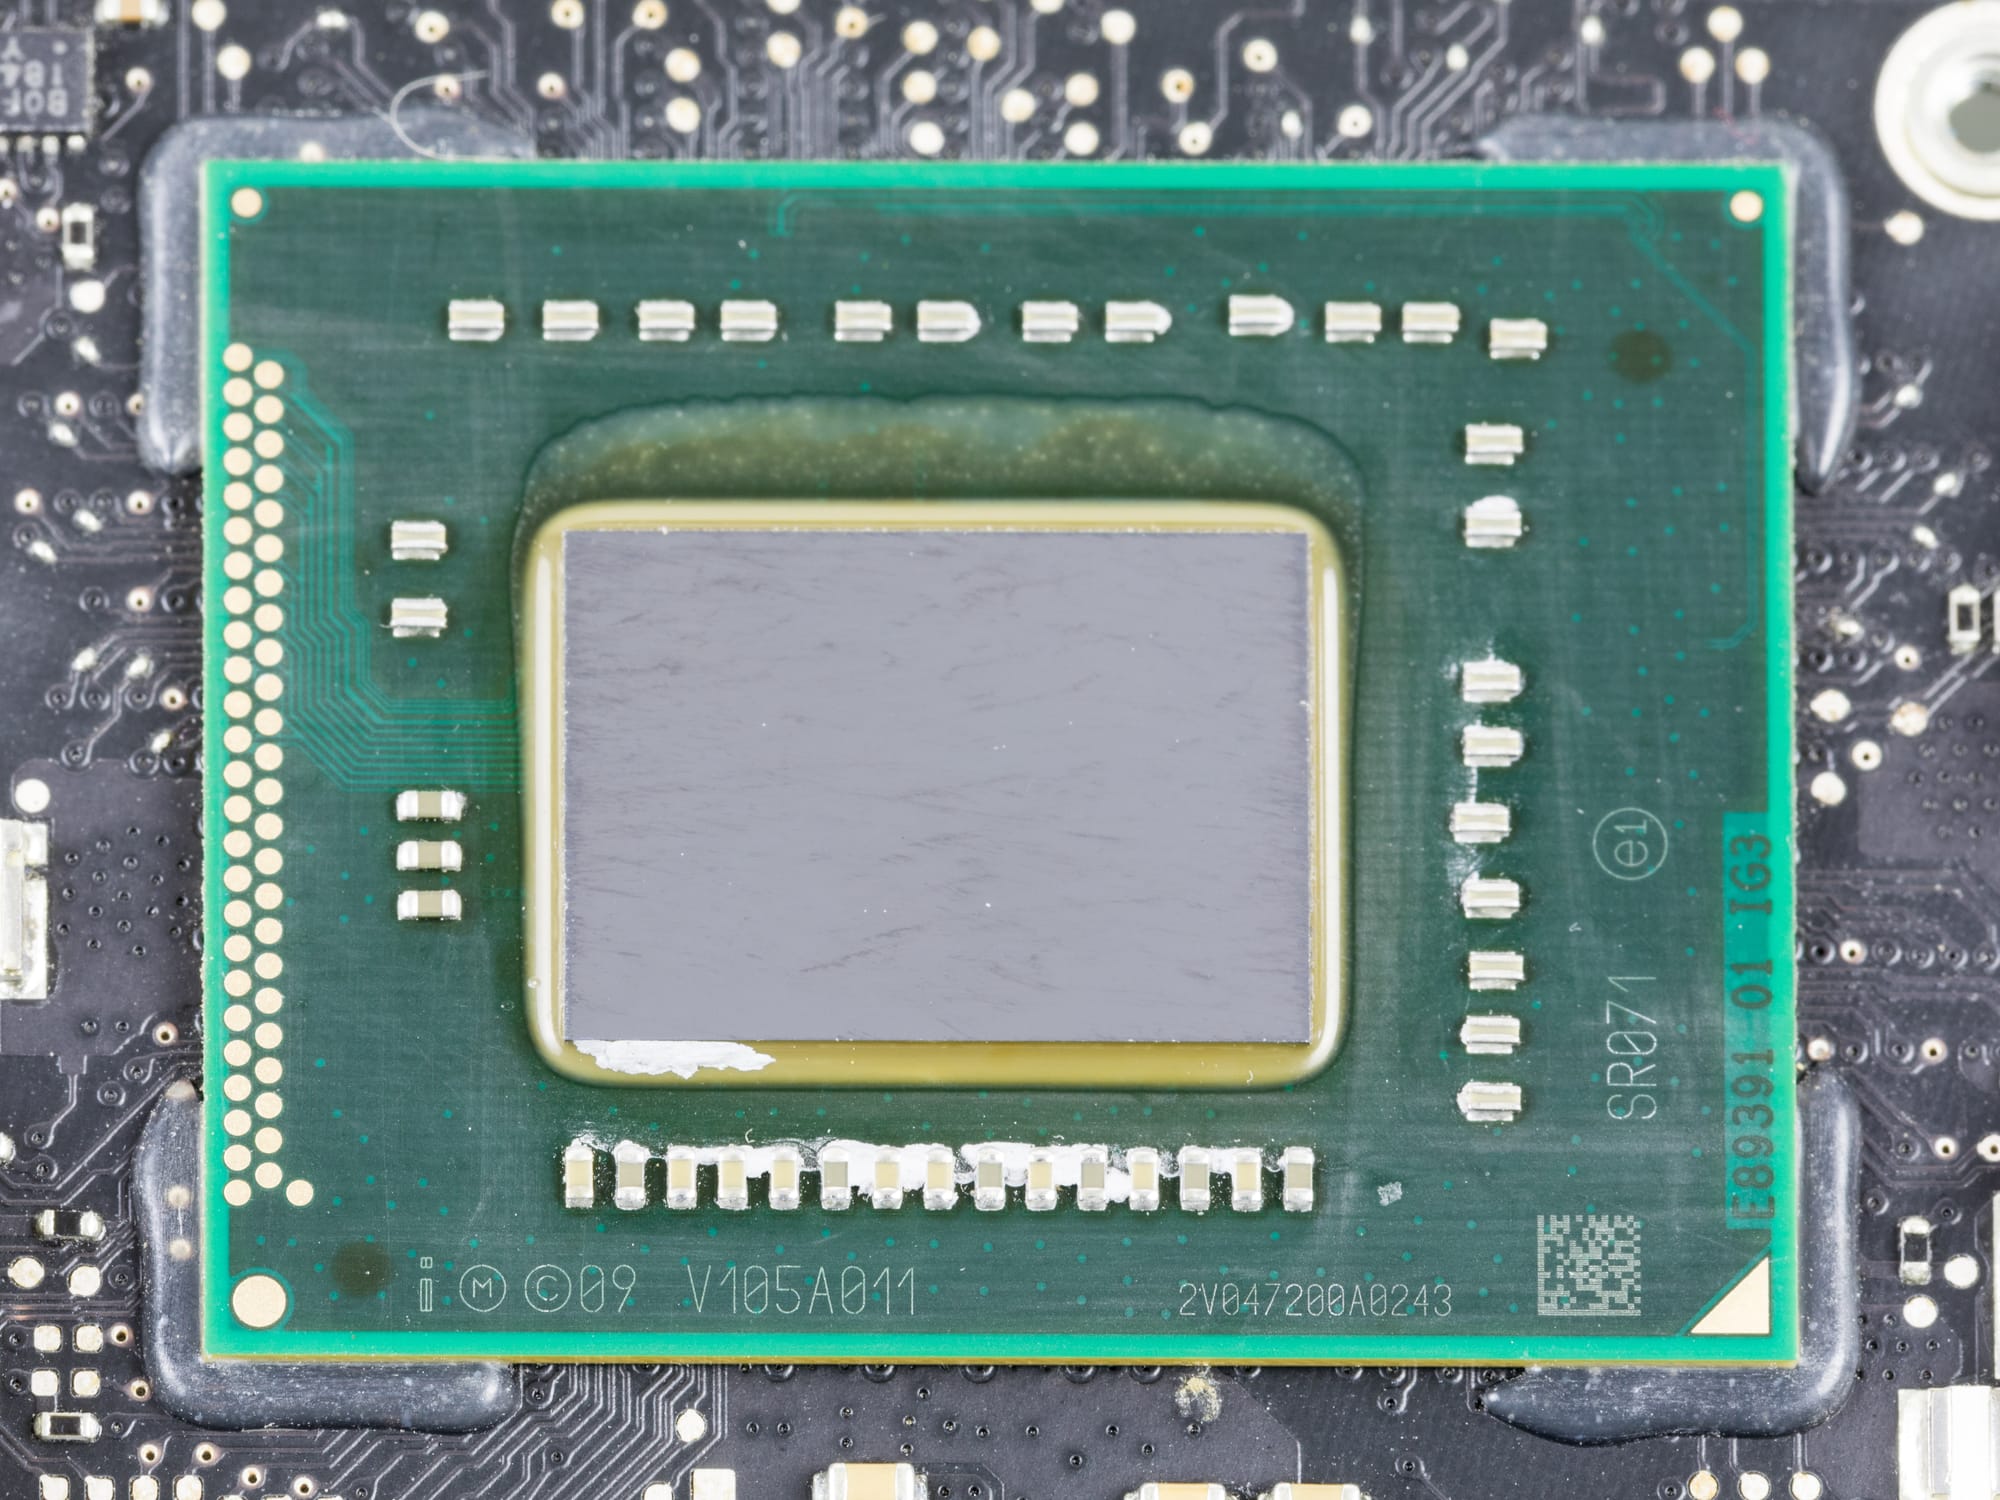
FC-BGA becomes clearer when the layers below a chip are separated. An interposer connects compute die and memory; a package substrate carries signals and power from that assembly to the main board; the main board connects the system's other components. Calling all three “AI packaging” obscures which process capability is expanding.
TSMC's public CoWoS descriptions distinguish S with a silicon interposer, R with an RDL interposer, and L with RDL plus local silicon interconnects. The distinction explains an interconnect structure. It does not permit Samsung Electro-Mechanics' substrate investment to be translated into additional CoWoS capacity as a whole. TSMC CoWoS technology.
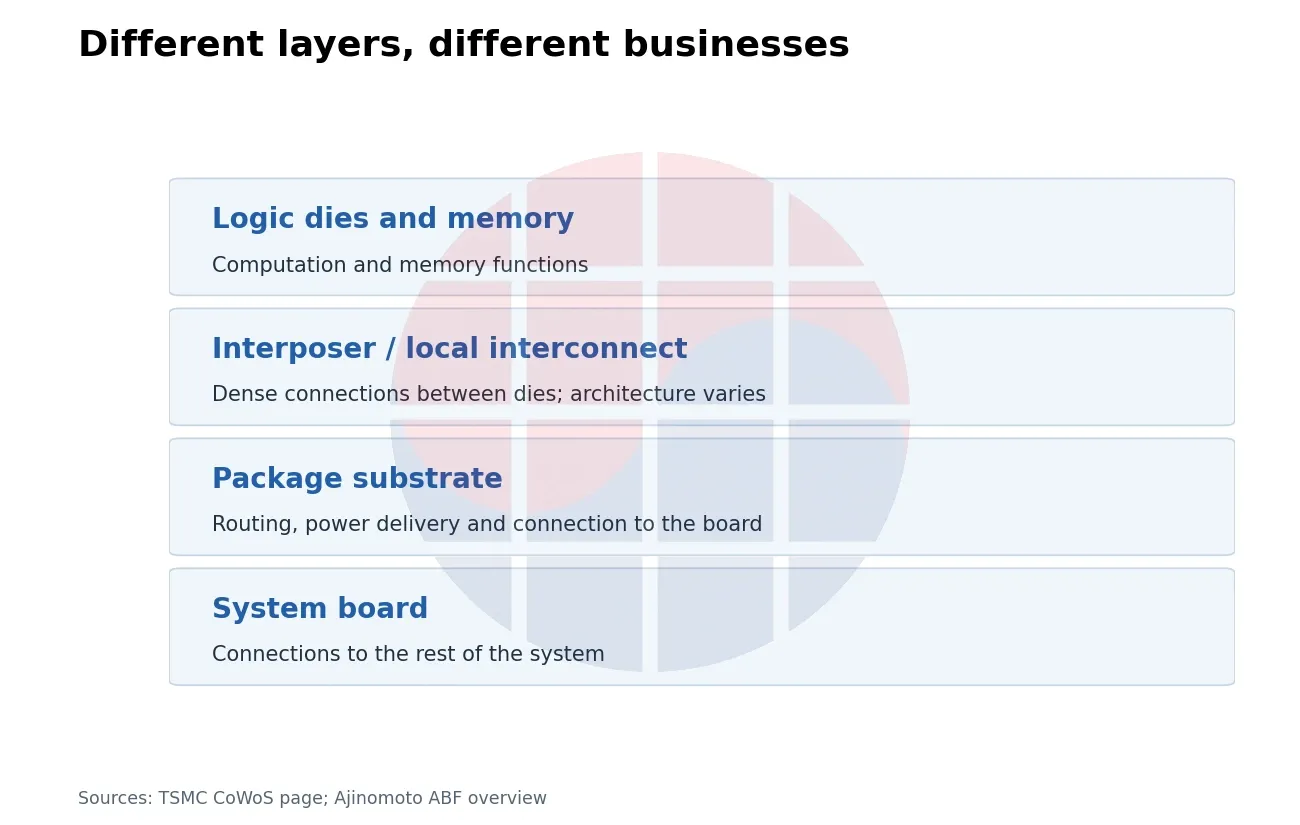
A package substrate contains repeated copper wiring, insulating layers and vias connecting layers. Ajinomoto Build-up Film, or ABF, is an insulating material used in this context. That is why ABF revenue, FC-BGA revenue and complete-package revenue cannot be treated as one market. A material supplier manages use and material composition; a substrate manufacturer separately manages process load and good-output yield. Ajinomoto ABF overview.
As a compute die and HBM arrangement grows, substrate dimensions, interconnect count and power-delivery conditions may move with it. They do not rise at one common rate in every product. Design changes with die placement, power regions, signal speed and mechanical requirements, so GPU shipments alone cannot describe substrate processing load.
At KPCA in 2026, Samsung Electro-Mechanics identified warpage, high-speed signalling, fine circuits and fine vias as technical issues for large-area, high-layer-count substrates. This is different from simply stamping out a wider panel. Even as area increases, planarity and interconnection reliability must meet assembly conditions before shipment to a customer. Samsung Electro-Mechanics KPCA technical release.
Consider a small design example to show how processed area becomes product count. Let usable square-panel area after edge exclusion be 500 mm × 500 mm, and omit streets, inspection coupons and rotation. This is not any manufacturer's actual panel format; it isolates the area effect.
At a 50 mm package side, the panel holds 10 × 10 units; at 70 mm, 7 × 7; at 100 mm, 5 × 5. The site counts are 100, 49 and 25. Actual layouts need margins and shape constraints, but the relationship remains: the same processed area can produce very different unit counts.
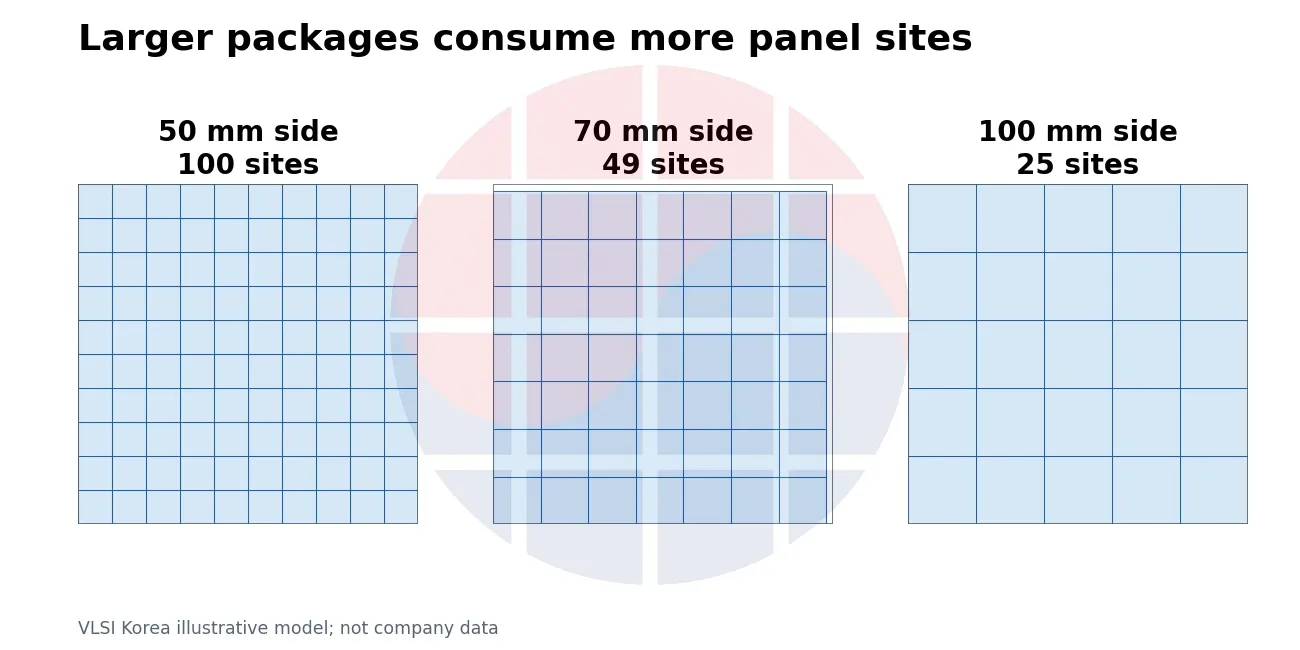
From 70 mm to 100 mm, individual package area rises about 2.04 times, while panel site count in this example falls about 49%. If panel processing cost and good yield are unchanged, allocated processing cost per good unit rises by 49 ÷ 25, or 1.96 times. A higher average selling price by itself therefore does not establish a profit improvement.
Repeated processing adds a second burden. When the number of operations that must traverse the same equipment rises, one tool's monthly pass count can stay constant while the number of completed panels falls. In a thought experiment holding bottleneck throughput fixed, moving from 10 to 20 passes per panel halves panel throughput. Parallel tools and process-specific times will change that relationship in a real factory.
“Area capacity growth” and “good-unit growth” are consequently different measures. An added toolset may make more of an existing product, or it may absorb the work required by larger and more complex structures. The same investment amount can yield a different number of finished units delivered to customers.
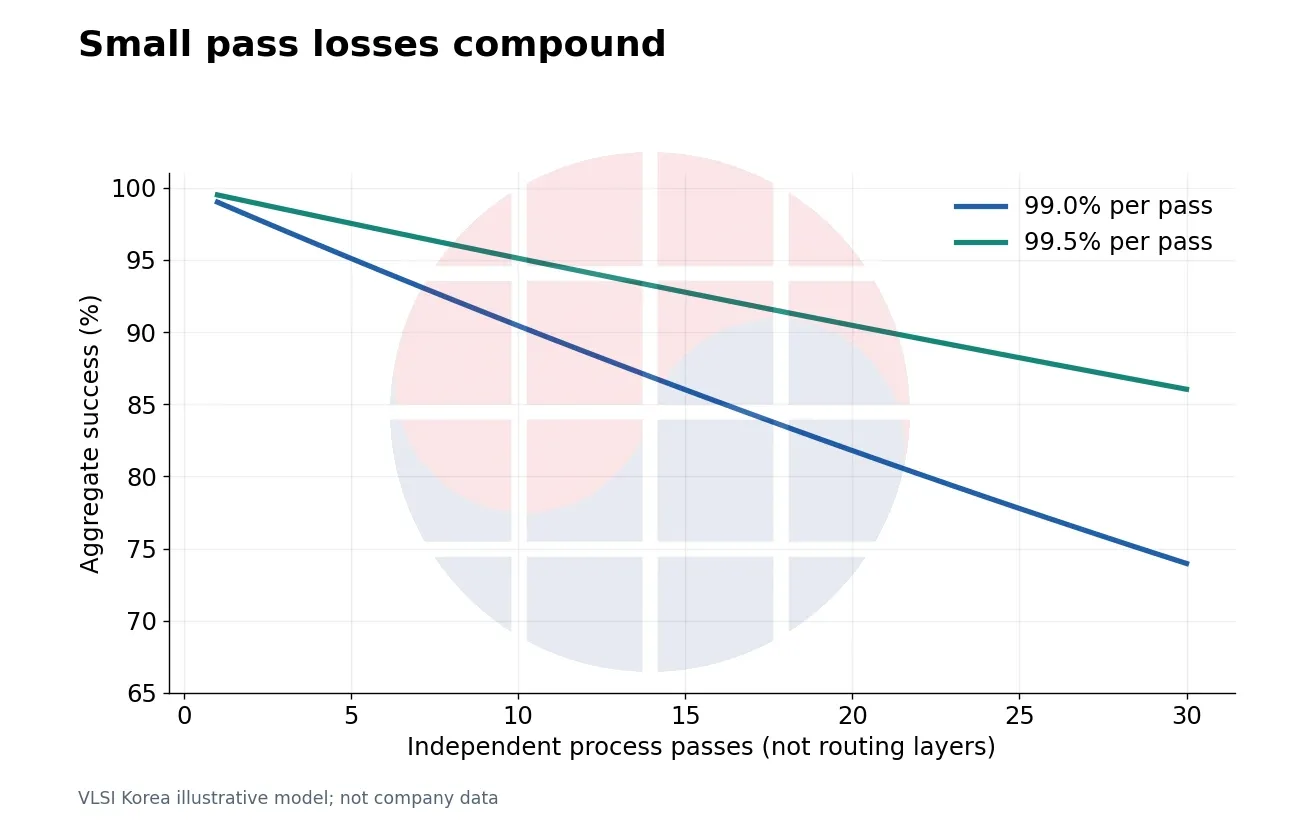
The yield effect across passes can also be calculated. If each independent process pass has a 99% success rate, success after 10, 20 and 30 passes is about 90.4%, 81.8% and 74.0%. At 99.5%, the corresponding values are about 95.1%, 90.5% and 86.0%. The example shows how small individual improvements can make a large output difference across a long path.
A pass is not a physical routing layer, and these yields are not observations from any company. Real defects are correlated and intermediate inspection and rework intervene. The calculation exposes variables missing from a model that estimates supply only from a larger footprint; it does not estimate a factory's precise yield.
3. How customer-accepted capacity is made
The important output from a substrate factory is not merely the number of panels that pass an inspection machine. It is good output verified for use under a particular customer's product and process conditions. Even when the substrate's own electrical test passes, interconnection, thermal and mechanical outcomes after die attach and package assembly must meet the required conditions. That is the gap between equipment readiness and stable product supply.
This article calls the result qualified good-output capacity. The phrase is an editorial calculation frame, not a common industry disclosure metric. It means connecting factory input capacity to utilisation, product-specific sites per panel and final acceptance yield, so that expected output deliverable to a customer can be assessed.
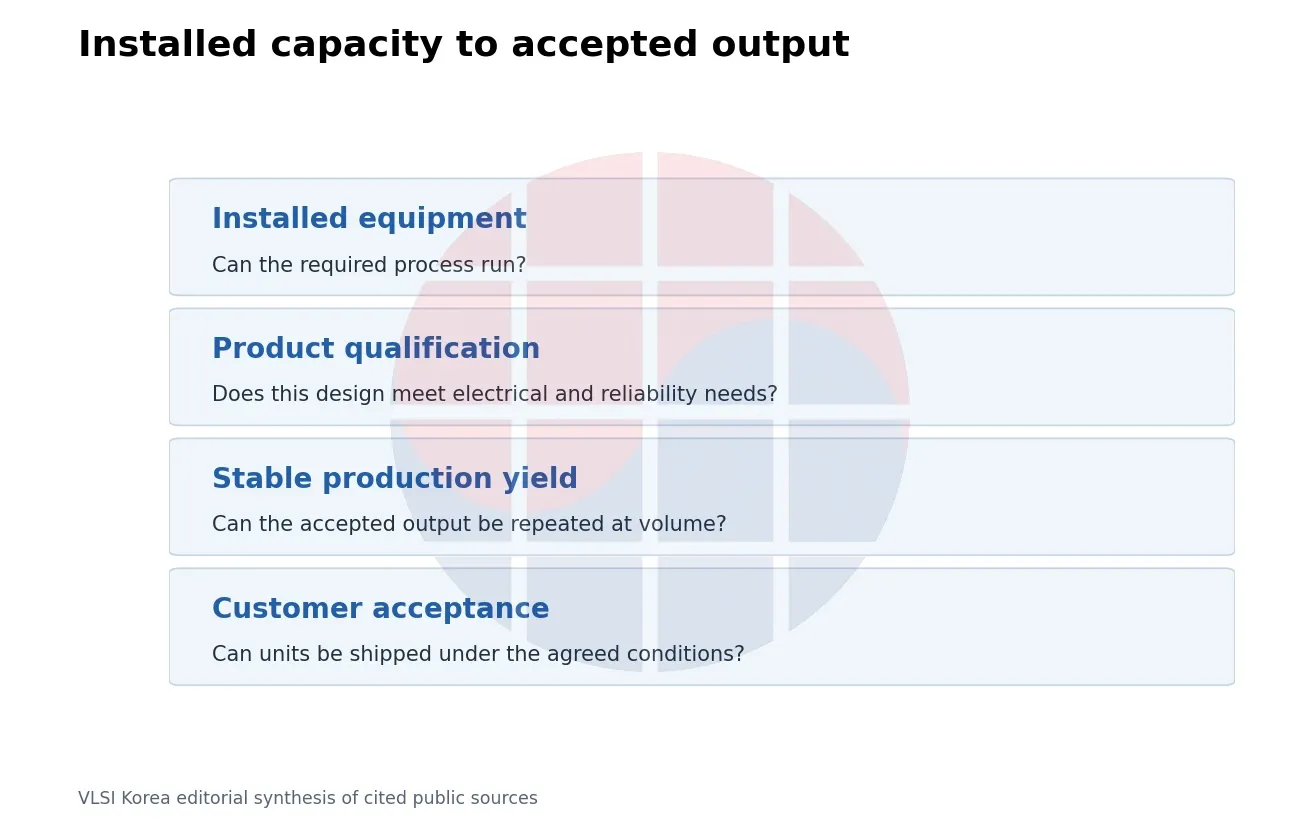
Customer qualification does not make every future change equivalent to a single approval stamp. What must be reverified when product size, stack, material or production location changes depends on the product and customer conditions. The useful question is not simply whether a company says “qualified,” but which product and production conditions the statement covers.
Procurement asks a more concrete question: how much good output can be assembled to the required design at the required time, what is the scope of a new supplier change, and whether an existing product can substitute if delivery slips. Factory floor area and tool count can be inputs to that question, but they are not the completed answer.
Ibiden's 2026-08-05 Q&A illustrates the distinction. The company separated an EMIB-T technical-establishment stage from a mass-production yield-improvement stage. It also described sequential Gama operation from the end of FY2027 and financial contribution in FY2028. This is the company's own distinction between implementing a technology and preparing profitable mass production. Ibiden quarterly Q&A.
An early-year investment announcement and a later operating explanation should not be compressed into one sentence. Ibiden's 2026-02-03 announcement distinguishes about JPY 500 billion of electronics investment for FY2026-FY2028 from a first phase of about JPY 220 billion within that total. The later operating description is needed to see the timetable from investment approval to production. JPY 220 billion is not an amount to add to JPY 500 billion. Ibiden investment plan.
These stage differences reach the income statement through three paths. First, lower initial good yield reduces sellable output at the same input cost. Second, ramp labour and some fixed cost arise even before shipments are sufficient. Third, depreciation on equipment available for use can be out of time with revenue growth. Actual recognition requires the applicable accounting policy and asset status.
Treating every pre-production cost as “one-time” can overstate the economics of a business with continuing new-product transitions. Fixing early costs as the normal cost of mature utilisation can instead miss learning. Comparison across product families becomes possible only when the cost and duration of earlier production transitions can be observed.
| Milestone | What it establishes | Still needed |
|---|---|---|
| Tool installation | Installed process capability | Product and assembly qualification |
| Product qualification | Defined design and condition accepted | Repeatable yield and available volume |
| Volume ramp | More accepted output | Stable mix, contribution and collection |
| Reported revenue | Recognised sales in the period | Cash timing and reinvestment burden |
Source: VLSI Korea analytical framework; Ibiden Q1 FY2026 Q&A provides a separate real ramp example.
Price also needs to be separated. An increase in contract price for the same product, a greater revenue mix of larger substrates, and pass-through of higher-priced materials can each increase ASP. Their effects on contribution per unit area and cash flow are different.
Ibiden discussed ASP factors and customer pass-through of higher material cost in its Q&A. That is evidence that price negotiations affect substrate economics. It is not a basis for applying an Ibiden price change to another company, or for treating all higher prices as pure profit.
An analyst can put quantity, price, product mix and material pass-through into separate estimate lines. Without product-specific data, preserve a range and state the production and contract conditions each case needs rather than fill the gap with one precise number.
4. If customers support investment, who bears what
Samsung Electro-Mechanics said this investment includes funding support from global customers and the securing of medium- to long-term volumes. That implies a funding structure different from a supplier forecasting demand and funding the full investment alone. The public announcement does not disclose the support amount, customer weightings, payment or offset terms, or a numerical guarantee of volumes. The word “support” alone cannot determine the funding's legal or accounting nature.
The analytical focus should be where support moves the burden, not merely whether it exists. If a customer pays cash first, the supplier's initial funding burden may fall. If future volume, price or dedicated-capacity commitments attach, the supplier must manage cost and yield within those conditions. Actual contract clauses are the relevant evidence when disclosed.
AT&S's 2026-06-13 announcement is a comparison case. The company said it was pursuing EUR 1.5-2.0 billion of Kulim investment based on key-term agreements with AMD and another technology customer. It also stated that final negotiation and execution of long-term customer commitments remained at that time. That describes the contract state on that date; it is not evidence that arrangements remain unsigned now. AT&S announcement.
The same release's FY2026/27 CAPEX guidance of EUR 1.0-1.2 billion is an annual spending plan. Adding it to the EUR 1.5-2.0 billion multi-year investment range would double count. Converting Samsung Electro-Mechanics, Ibiden and AT&S figures through a single exchange rate to make one aggregate bar also needs their investment periods, business boundaries and overlap with earlier announcements resolved first.
| Company / date | Disclosed scope | Amount / boundary |
|---|---|---|
| Samsung / 2026-09-28 | Sejong facility expansion | KRW 4.27 trillion |
| Samsung / 2026-09-28 | Vietnam equipment investment | KRW 2.51 trillion |
| Ibiden / 2026-02-03 | FY2026-FY2028 electronics plan | Approx. JPY 500 billion |
| Ibiden / 2026-02-03 | First phase, included above | Approx. JPY 220 billion |
| AT&S / 2026-06-13 | Kulim investment framework | EUR 1.5-2.0 billion |
| AT&S / 2026-06-13 | FY2026/27 CAPEX guidance | EUR 1.0-1.2 billion |
Sources: linked issuer disclosures. Keep original currencies and periods. No cross-company total or FX conversion.
Economically, customer support can be understood as valuing the reservation of needed future capacity. The supplier may reduce investment burden and the customer may advance equipment readiness. That explains a contractual motivation; it does not reveal the margin the customer permits.
The first contractual distinction is between non-repayable support and an advance deducted from later product payments. An advance increases cash today but may reduce cash received on future shipments. Its nature must be determined from settlement clauses and related financial-statement items, not from its label.
The second is between a demand commitment and product-acceptance conditions. Even if a customer plans volume, economic results can differ when a supplier cannot provide the required product on time. Turning public language about “secured volumes” into cash that is inevitably paid removes manufacturing and contractual risk together.
The third question is who bears residual value in equipment. When processes and tools tuned to a particular product move to the next generation, further investment and modification cost matter. Highly dedicated equipment can improve order stability while limiting the option to fill it with another customer's volume.
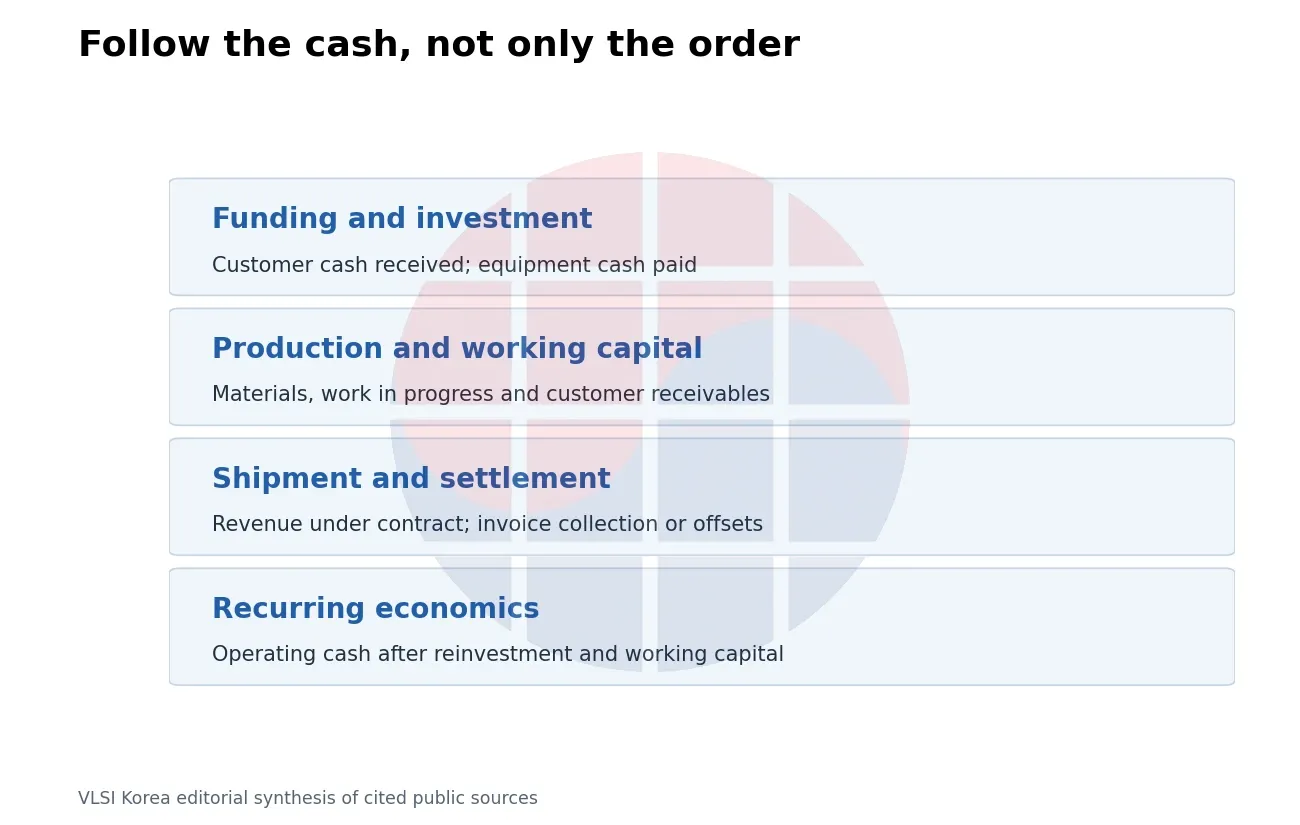
Fourth, customer and supplier cash timing must be separated. Signing a support arrangement, receiving cash, paying for tools, shipping product and offsetting invoices are distinct events. If the supplier pays equipment before it receives support, the interim funding burden remains. Contract total alone is insufficient without payment conditions and progress conditions.
VLSI Korea view: Customer funding can change the starting point of investment recovery. If it is deducted from future shipment payments, it cannot be read as recurring operating performance every year.
For an investor, the more useful comparison is not “who announced the larger investment?” but “who secured which funding first, and under what good-output conditions is it repaid or settled?” This does not rank Samsung Electro-Mechanics above a named competitor. It shows that undisclosed contract terms sit at the centre of a value judgment.
5. Connecting utilisation, yield and price to cash
The following model is a normalised annual design example, not a forecast of company results. It uses no company's production volume, yield or substrate price. Currency is a hypothetical CU, rather than KRW or USD, and tax, interest, foreign exchange and financing are excluded.
Assume equipment can start a maximum of 100 panels annually. Panel sites are 49, as in the preceding 70 mm example. Base utilisation is 75%, final good yield is 80%, and selling price per good unit is 100 CU. Variable cash cost per started panel is 1,600 CU, annual fixed cash cost is 70,000 CU, and depreciation is 40,000 CU.
| Input | Downside | Base | Upside |
|---|---|---|---|
| Nameplate panel starts | 100 | 100 | 100 |
| Sites per panel | 49 | 49 | 49 |
| Utilization | 55% | 75% | 90% |
| Final good yield | 65% | 80% | 90% |
| ASP (CU / good unit) | 95 | 100 | 105 |
| Variable cash (CU / started panel) | 1,650 | 1,600 | 1,550 |
| Fixed cash cost (CU) | 70,000 | 70,000 | 70,000 |
| D&A (CU) | 40,000 | 40,000 | 40,000 |
| CAPEX cash (CU) | 120,000 | 120,000 | 120,000 |
| Increase in NWC (CU) | 30,000 | 20,000 | 40,000 |
Source: VLSI Korea constructed example. No company forecast; one normalized annual period. Tax, interest, FX and financing excluded.
Base starts are 100 × 75% = 75 panels, and expected good units are 75 × 49 × 80% = 2,940 units. Revenue is 294,000 CU and variable cash cost is 120,000 CU. After fixed cash cost, the EBITDA proxy is 104,000 CU; after depreciation, the EBIT proxy is 64,000 CU.
They are called proxies to distinguish them from disclosed EBITDA or operating profit. The example simplifies plant conversion cost and does not include every corporate cost. Its purpose is not belief in the absolute value of 64,000, but visibility into how each input changes the result.
After annual equipment payments of 120,000 CU and a 20,000 CU working-capital increase, the pre-tax cash proxy is -36,000 CU. EBIT remains positive, but post-investment cash declines. The same structure can arise when receivables and inventory grow faster than collections, or when equipment payment is concentrated.
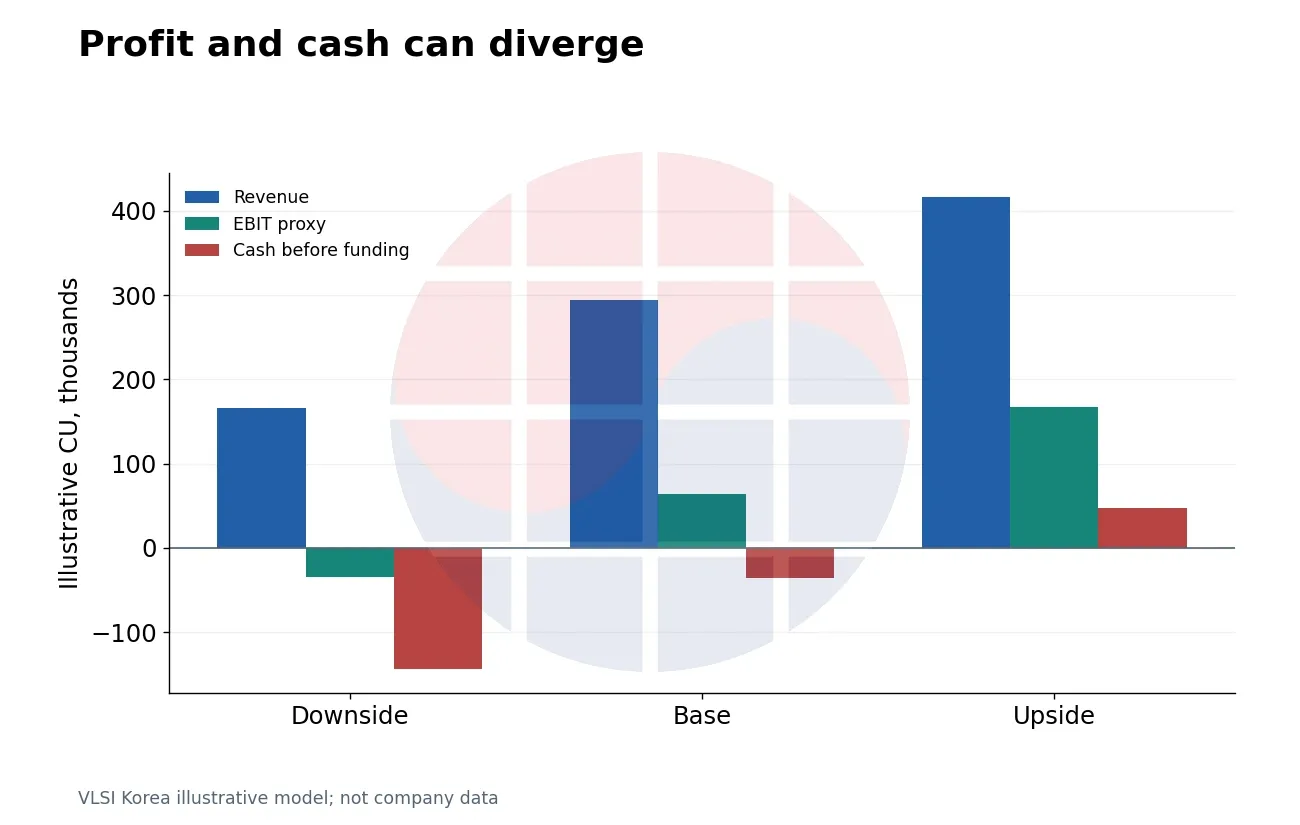
The downside, base and upside cases are conditional combinations of demand, yield, price and cost. They use utilisation and good yield of 55% and 65% in downside, 75% and 80% in base, and 90% and 90% in upside. Selling prices are 95, 100 and 105 CU; variable costs per started panel are 1,650, 1,600 and 1,550 CU. They are not a probability distribution for the industry.
Working-capital increases are 30,000 CU in downside, 20,000 CU in base and 40,000 CU in upside. The downside assumes greater inventory and collection delay; the upside assumes funding needed for a larger business. Fixed cash cost, depreciation and equipment payments stay constant across the three cases to isolate output and operating conditions.
| Output | Downside | Base | Upside |
|---|---|---|---|
| Panel starts | 55 | 75 | 90 |
| Expected good units | 1,751.75 | 2,940 | 3,969 |
| Revenue (CU) | 166,416.25 | 294,000 | 416,745 |
| Variable cash cost (CU) | 90,750 | 120,000 | 139,500 |
| EBITDA proxy (CU) | 5,666.25 | 104,000 | 207,245 |
| EBIT proxy (CU) | -34,333.75 | 64,000 | 167,245 |
| Cash before customer funding (CU) | -144,333.75 | -36,000 | 47,245 |
Source: VLSI Korea model. Fractional expected units reflect a continuous expectation, not a physical shipment. These are simplified proxies.
The downside EBIT proxy is -34,333.75 CU, base is 64,000 CU, and upside is 167,245 CU. Pre-tax post-investment cash proxies are -144,333.75 CU, -36,000 CU and 47,245 CU respectively. The same nominal equipment can produce sharply different cash outcomes when good output and contracted price differ.
Downside expected good units of 1,751.75 do not mean fractional chips are shipped. They are expected output using utilisation and yield as continuous variables. An actual order and shipment plan requires integer lots, product-specific designs and production scheduling. Keeping that distinction prevents a simplified model from appearing to be a factory plan.
At base conditions, a five-percentage-point increase in yield alone raises revenue and EBIT by 18,375 CU. A five-percentage-point increase in utilisation alone raises EBIT by 11,600 CU after additional variable cost. A 5 CU price increase alone raises it by 14,700 CU. Each is a sensitivity holding other inputs fixed; it does not assume the three gains occur together.
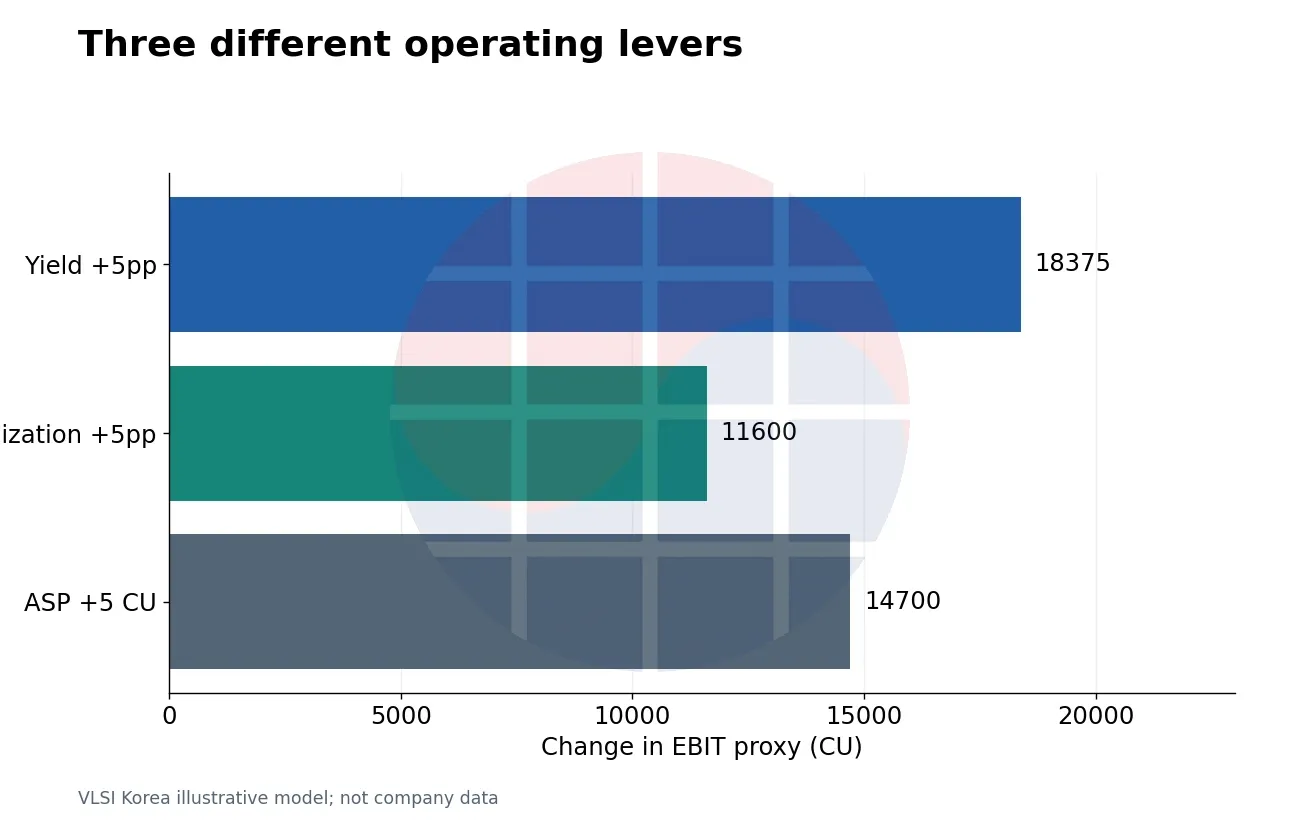
The figures do not establish that yield improvement is always best. If it needs more inspection, material, time or equipment, those costs must be subtracted from the benefit. A price increase that reduces volume, or utilisation growth that damages process stability, changes other inputs. The model shows where such interactions should be added.
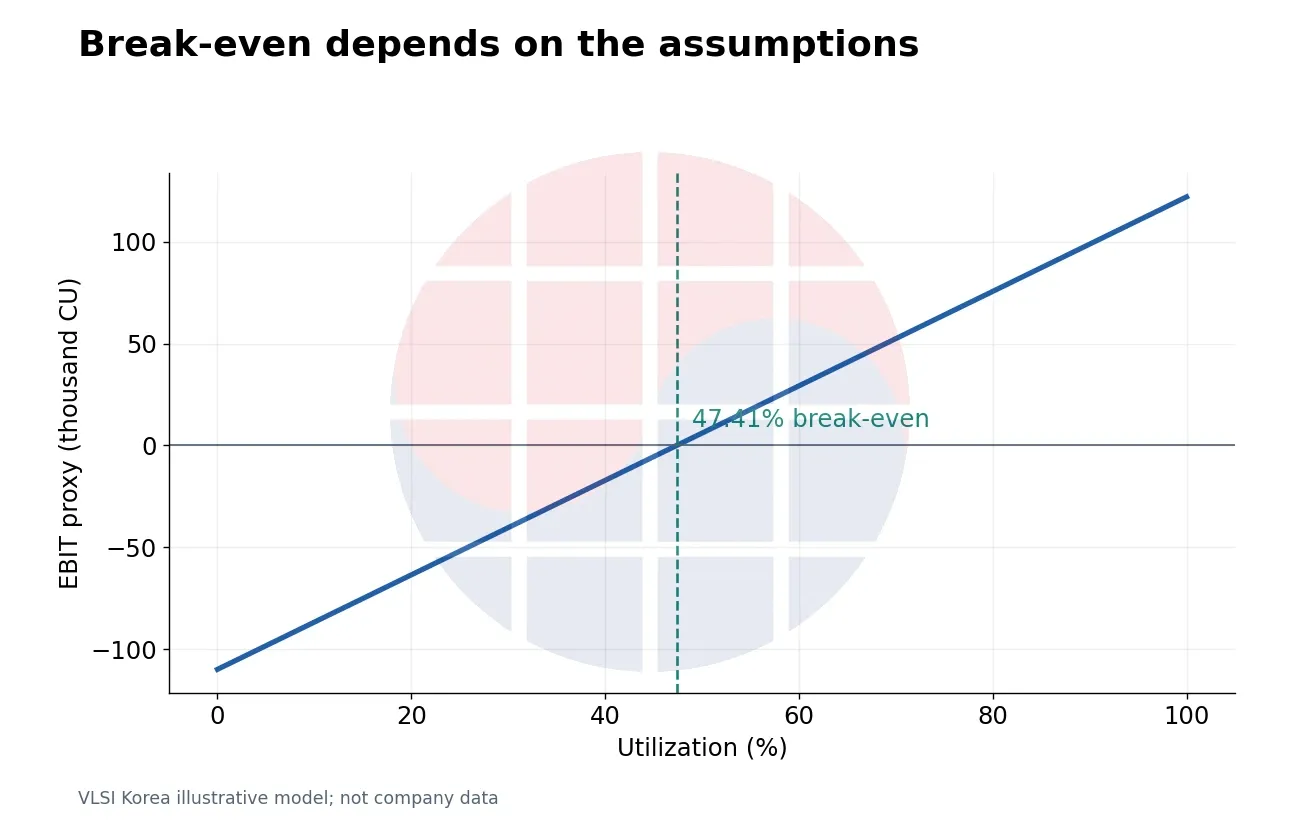
At base price, yield and cost, EBIT break-even utilisation is about 47.41%. The calculation is (fixed cash cost 70,000 + depreciation 40,000) ÷ [100 × (49 × 80% × 100 - 1,600)]. It is the result of the assumed cost structure, not an actual company's utilisation.
At base utilisation of 75%, the break-even good yield is about 62.59%. The numerator is variable cost of 120,000 CU plus fixed cash cost and depreciation of 110,000 CU; the denominator is 75 × 49 × 100. It shows why good-yield improvement can remain the condition for profit conversion after capacity has been secured.
If invested capital is fixed hypothetically at 500,000 CU, the pre-tax return proxy on base EBIT is 12.8%. It is not formal ROIC, which uses after-tax operating profit and average invested capital. A real comparison would align tax, average assets, construction in progress and customer-funding accounting treatment.
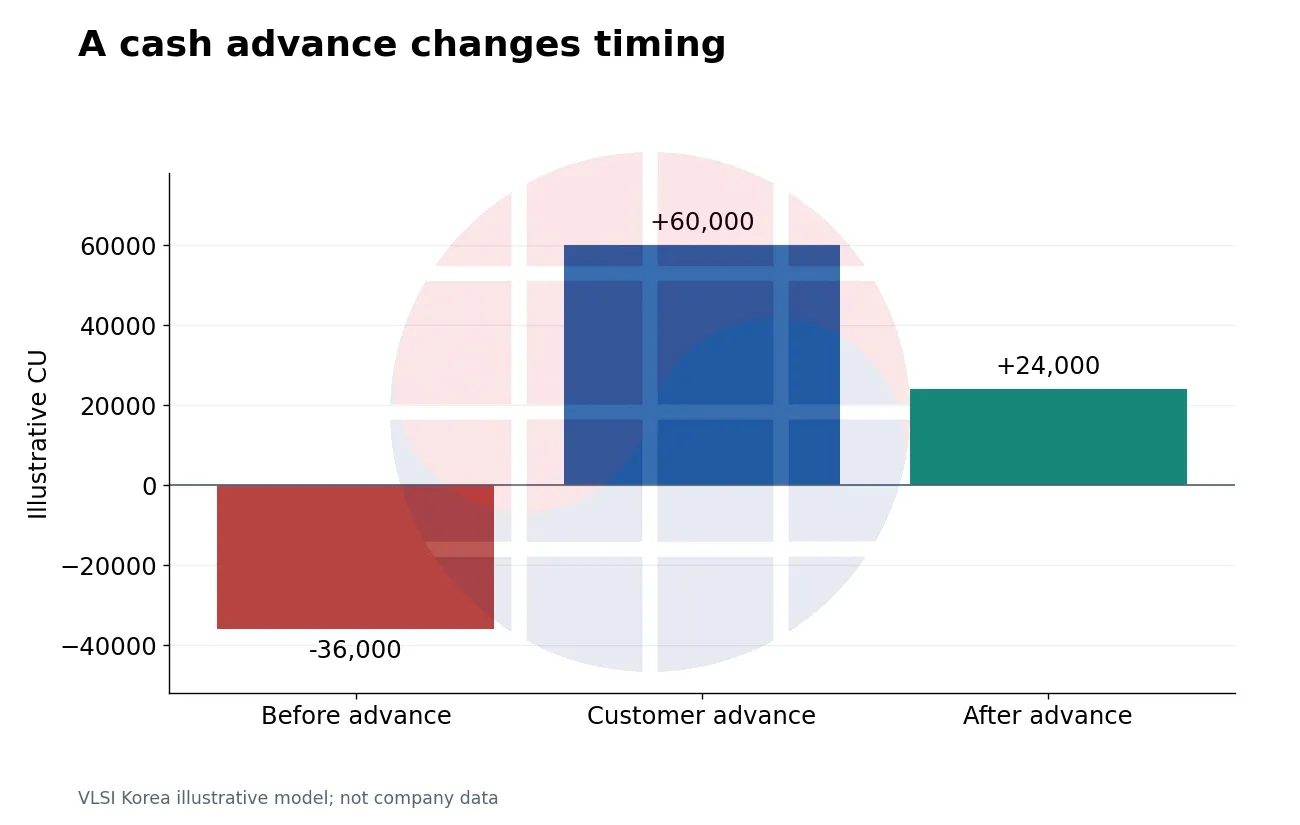
Finally, put a 60,000 CU customer advance into the base case. Current-period cash changes from -36,000 CU to +24,000 CU, while revenue and EBIT in this example do not change. If the advance is fully offset against later invoices, later cash receipts are lower by the same 60,000 CU. This is why funding support and recurring profit require separate treatment.
Actual contracts may take other forms, including subsidies, services or supply commitments. This advance structure is not applied to Samsung Electro-Mechanics or AT&S. When contract terms are public, users can recalculate the model by changing cash receipt, revenue-recognition and offset lines separately.
6. Korea's supply-chain opportunity extends beyond plant area
The point where larger, higher-layer-count substrates become an opportunity is not only final-substrate sales. Insulation and copper- and glass-fibre-related materials, via processing, plating, lithography, inspection, process control, package assembly and reliability evaluation can each see distinct demand. They do not recognise revenue from the same investment amount at the same point in time.
Material suppliers may provide inputs before good output ships. If scrap and rework rise, material input can increase even while the customer's good-output productivity deteriorates. Material use should therefore not be mapped one-for-one to final demand. The first question is where in the chain revenue occurs.
| Layer | Useful operating question | Cash interpretation |
|---|---|---|
| Materials | Input consumption, approved material mix | Input demand can differ from final good-unit demand |
| Equipment | Delivery, installation and contract acceptance | Project timing and contract terms matter |
| Substrate fabrication | Accepted units, yield and process burden | Unit contribution plus working capital |
| Assembly / packaging | Assembly yield and customer acceptance | A different process and financial perimeter |
Source: VLSI Korea analysis. This table establishes no named supplier relationship or revenue-recognition policy.
Tool suppliers focus on delivery, inspection and installation schedules; substrate makers on good output and customer acceptance; assembly companies on package-stage productivity and shipment. Revenue-recognition conditions depend on individual contracts. Applying the same earnings-growth rate to every related supplier after one plant announcement removes the causal path.
For Korean material, component and equipment companies, “could be used in AI substrates” is not equivalent to “supplies this investment.” After possible product application, the relevant evidence is approved-material or equipment status, required specification, customer-evaluation stage and repeat-supply structure. This article does not create a list of unverified domestic beneficiaries.
If a reader has identified a supply relationship, more useful questions follow. Is the input a consumable whose revenue grows only when panel starts rise, equipment supplied once when a line is built, or an input saved as good yield improves? The same productivity improvement can move supply-chain companies in different directions.
| Question | Evidence to request | Decision improved |
|---|---|---|
| Can this line make the required product? | Design, material and site qualification scope | Supplier and product selection |
| When is usable supply available? | Accepted output and delivery schedule | Buffer and ramp planning |
| Can another line substitute? | Requalification and process-change scope | Contingency planning |
| What does the contract protect? | Volume, acceptance, timing and settlement terms | Funding and inventory commitments |
Source: VLSI Korea decision framework. No private customer or RFQ data used.
Samsung Electro-Mechanics describes Sejong as a base for high-value, high-difficulty products and Vietnam as a base for volume response and efficiency improvement. This division of roles is the company's plan. Investors can check whether future product mix and mass-production paths reflect it. It is a better starting point than treating the two plants as technically identical copies and simply adding them.
There is also a counter-path. If customers change package structure or product generation, existing substrate size, layer count and material requirements can change. A long-term volume commitment does not independently solve the technical question of which structure and process make that volume. Equipment dedication and reuse range connect here to investment recovery.
Glass core is one such counter-path. Intel's 2023 announcement gave mechanical and thermal stability and interconnect density as development reasons, and on 2026-07-24 it announced related process-development collaboration with Lens Technology. Those two sources show that the technical option is advancing; they do not show that organic substrates will soon be fully replaced or that commercial-production revenue is already fixed. Intel glass-substrate release, Intel-Lens collaboration.
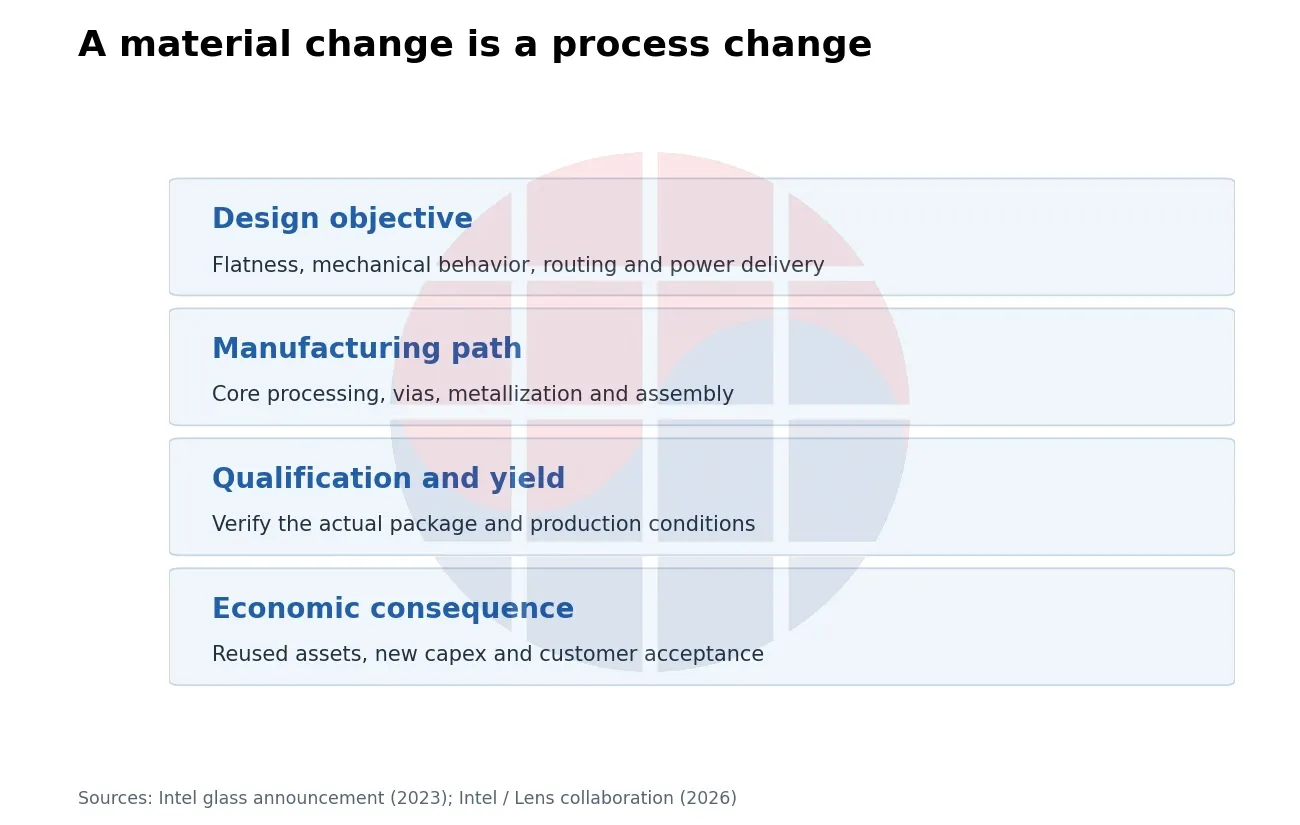
It is equally premature to infer from the word “glass” that materials demand disappears. Even if the core changes, the configuration of required wiring, insulation and interconnection processes depends on the design. Which functions are replaced and which processes remain must be assessed by structure. Material selection follows the thermal and mechanical conditions, manufacturability and cost of the full package holding the chips.
Samsung Electro-Mechanics presented both organic-substrate improvements and glass-substrate technology at KPCA. The exhibition signals preparation across paths; it does not mean the announced investment is entirely for one next-generation structure. The mix of existing and next-generation processes in new investment should be reflected only to the extent disclosed.
From a portfolio perspective, the focus can be capabilities that persist through a material transition, rather than a binary material winner. Precise interlayer connection, surface and form control, inspection and process stabilisation are problems that must be solved again as structures change. This is not a revenue guarantee for a specific company; it narrows the supply-chain functions to investigate during transition.
7. What evidence would change the judgment
The central judgment is that customer-supported substrate expansion requires funding availability and mass-production economics to be assessed separately. It is strengthened when actual support cash, repeated shipment of qualified products, cost improvement and post-investment cash collection appear together. An investment announcement or a single pilot-production observation alone does not verify the full path.
The judgment must change if profit improves only through recognition of support without shipment growth, or if revenue grows while inventory and receivables grow faster. The question then becomes whether the improvement is production productivity or contract timing. If a future disclosure explains the economic character of customer support, the cash-model assumptions change first.
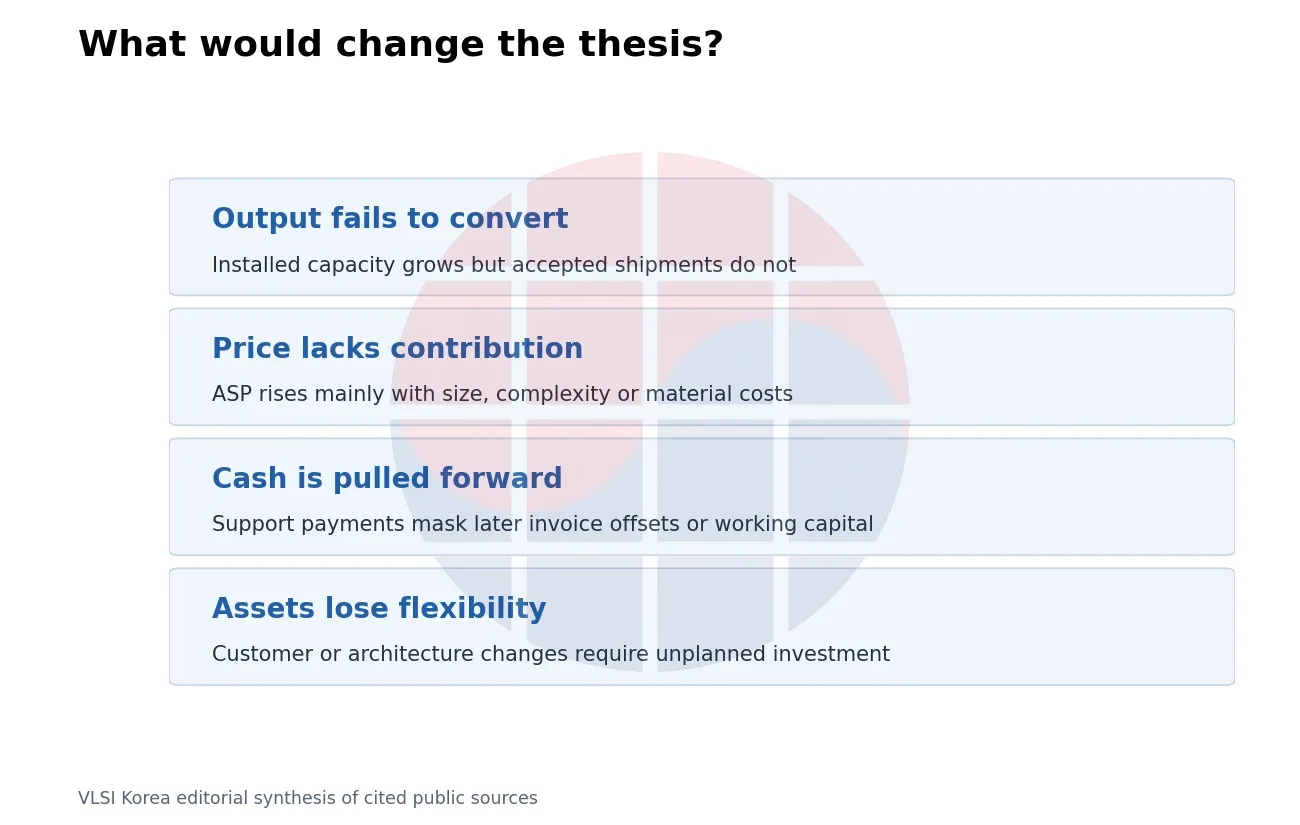
Risks should connect cause to observable evidence. Customer concentration is tracked through contract changes and alternative use of dedicated equipment; material risk through approved sources and cost pass-through; manufacturing risk through good output, rework and customer acceptance. Schedule delays should be separated into equipment, staffing and process-readiness causes.
Price risk is better assessed by separating price for the same product, change in area and layer count, and material pass-through than by ASP alone. Cash risk includes future offset or refund terms and working capital, not simply cash support received. Technical-transition risk is the availability of transferable processes and the additional investment required, not simply whether there is one glass-substrate news item.
The following observation dates are editorial checkpoints, not company-confirmed earnings dates. 2026-11-30, 2027-03-31 and 2027-09-30 are editorial review dates. 2028-05-31 is Sejong's disclosed expected investment-end date, and 2028-09-30 is a month-end reference for the company's September mass-production target.
| Date | Status | Observation |
|---|---|---|
| 2026-11-30 | Editorial checkpoint | Next available quarterly demand and customer-funding disclosures |
| 2027-03-31 | Editorial checkpoint | Fiscal boundary; disclosed contract terms and cash flow |
| 2027-09-30 | Editorial checkpoint | Equipment and product-qualification progress |
| 2028-05-31 | Disclosed Sejong investment-end target | Spend versus production readiness |
| 2028-09-30 | Editorial month-end check | Sejong September mass-production target |
| 2030-06 | Vietnam company target; outside horizon | Construction completion and operation |
Sources: Samsung filings and 2026-09-29 release for company targets; VLSI Korea for editorial checkpoints. Targets may change.
The first review asks how a new quarterly release separates output at existing plants from new-investment explanation. The next examines long-term-commitment settlement structure and cash flow. Subsequent reviews check equipment readiness and product qualification, then separately assess mass-production readiness at the end of Sejong's investment period.
Vietnam's June 2030 operating target remains outside this article's 24-month decision window. That does not exclude the project; it avoids mixing expected profit inside the window with investment and supply choices outside it. If a new filing explains the relationship to the 2028-04-30 expected asset-acquisition date, the affected scope should be updated first.
| Reader | What to examine | Decision to defer |
|---|---|---|
| Sector analyst | Accepted output, price / mix and cash settlement | Mechanical capex-to-earnings conversion |
| Engineer / procurement | Product-specific qualification and assembly needs | Supply commitments based only on a factory opening |
| Investment committee | Recurring contribution versus accelerated customer cash | Treating all funding receipts as repeatable earnings |
Source: VLSI Korea analysis. No buy/sell recommendation, price target or implied valuation.
An analyst's decision change is to avoid entering the announced investment as an immediate revenue-growth rate. The estimate should separate qualified good output, price, material pass-through and settlement timing. Keep broad scenarios until product-level data are disclosed, then narrow the range only where evidence permits.
A design or procurement team's decision change is to avoid confirming available volume from factory-operation news alone. Connect the product's substrate structure, approval conditions, assembly timing and readiness of alternative lines. When capacity is tight, compare the cost of moving to a smaller structure or another supplier on the same basis.
An investment committee's decision change is to assess growth and funding quality together. If customer support improves immediate cash, determine whether recurring cost competitiveness improved or whether future cash was simply brought forward. The point at which an expected-profit assumption should change differs even with the same total investment.
Samsung Electro-Mechanics' KRW 6.78 trillion is not itself production volume or profit. Business outcome depends on which size and structure of substrate it produces, at which good yield, and under which customer terms. The central indicator for AI-substrate investment should move from plant area to qualified good output and cash after settlement.
Methods, sources and related reading
The evidence date is 2026-10-02. Investment and operating figures preserve their original KRW, JPY and EUR units. The CU model, panel layout, repeated-pass yield and sensitivities are VLSI Korea assumption-based calculations, not estimates of actual company output, price or return. The model input and result tables reproduce the same formulas.
Company investment and product announcements, filings and technical explanations are used as distinct sources. Samsung Electro-Mechanics filings and releases are compared as different company documents with different scopes and dates; peer disclosures are separate examples, not evidence of identical contracts. Individual customer-contract originals, factory yield, product ASP and investment-recovery rates are not public and are not filled in as facts.
For physical context, see VLSI Korea's CoWoS Economics and Glass Substrate CTE Analysis. This article extends the existing packaging and thermal-expansion explanations by examining the economic link between new investment and customer funding.
| Variable | Formula |
|---|---|
| Started panels | 100 x utilization |
| Expected good units | Started panels x 49 x yield |
| Revenue | Expected good units x ASP |
| Variable cash cost | Started panels x cost per started panel |
| EBITDA proxy | Revenue - variable cash cost - 70,000 |
| EBIT proxy | EBITDA proxy - 40,000 |
| Cash before customer funding | EBITDA proxy - change in NWC - 120,000 |
| Pre-tax return proxy | EBIT proxy / 500,000 |
Source: VLSI Korea. All monetary inputs use illustrative CU. This is not IFRS reporting or a formal ROIC calculation.
Primary sources
- Samsung Sejong investment filing
- Samsung Vietnam equipment filing
- Samsung investment release, 2026-09-29
- Samsung Q2 results, 2026-07-30
- Samsung KPCA technical release, 2026-09-10
- Ibiden capital investment, 2026-02-03
- Ibiden FY2026 Q1 Q&A
- AT&S customer-supported investment, 2026-06-13
- Ajinomoto ABF technical overview
- Ajinomoto materials interview, March 2026
- TSMC CoWoS technical overview
- Intel glass substrate announcement, 2023-09-18
- Intel / Lens collaboration, 2026-07-24
Disclosure
This article is provided for informational purposes only and does not constitute a recommendation to buy or sell any security. Figures and factual statements are based on publicly available sources, including company filings, news reports, and market research, and may contain errors in the source material or in the preparation of this article. The author may own shares in companies mentioned. All investment decisions and their outcomes are the reader's responsibility.
Related reading
- Daily Silicon: Marvell $2.739B: AI Silicon Design and GAA
- Why GlobalFoundries Is Making Silicon Interposers for TSMC — Inside the…
- Why Hybrid Bonding Is Hard to Perfect: The Yield War Behind 16-High HBM
- Equipment Is the Real Bottleneck: The Execution Test Behind Samsung and…
- Daily Silicon: Infineon €4.172B: AI Chip Power and Semiconductor Design